What does a 90% human preference win rate actually prove?
A model announcement reports that human raters preferred the new version 90% of the time. The number lands as decisive, and by itself it establishes less than almost anyone reading it assumes. A win rate is a proportion measured over a set of comparisons someone chose, judged by a population someone recruited, and reported without the two pieces of context that would let you interpret it. The figure used here is illustrative rather than drawn from any particular release, because the problem is structural: it applies to every win rate published without the disclosures below.
Key takeaways
- A win rate is a binomial proportion over a comparison set somebody chose, judged by a population somebody recruited. Both choices move the number more than most model changes do.
- The interval matters more than the point estimate, and it narrows only with the square root of the sample size. At 100 comparisons a 90% win rate carries a 95% interval of roughly plus or minus 5.9 points; at 30 comparisons it is roughly plus or minus 10.7.
- The reference bounds the claim. In a HumanSignal benchmark two professional linguists agreed with each other on roughly 72% of items, so a win rate far above a reference population's own internal agreement needs explaining.
- When a model does the judging, published work shows that imperfect judge sensitivity and specificity bias naive scores, and correcting that requires human-labeled calibration data.
- Four disclosures make a win rate checkable: the number of comparisons, the interval, the composition of the comparison set, and the reference population's agreement with itself.
What a win rate is, mechanically
Strip away the presentation and a preference win rate is a simple thing. You assemble a set of comparisons, show each to one or more judges, count how often judges picked option A, and divide by the total. The result is a proportion.
Two choices are baked into it before any judging happens. The first is which comparisons went into the set, since a set weighted toward cases where the new model was expected to do well will report a higher win rate without anything about the model differing. The second is who judges, since the proportion estimates the preference of the population you recruited and no other.
Neither choice appears in the headline number. Both move it further than most architecture changes do.
The four things a headline number omits
How many comparisons
A proportion from a sample carries sampling error, and the standard approach is to report a confidence interval alongside the estimate. For a binomial proportion the interval is approximately the estimate plus or minus 1.96 times the square root of p times one minus p over n.
The arithmetic is worth seeing. At 90%, a sample of 30 comparisons yields a 95% interval of roughly plus or minus 10.7 points, so the true rate could plausibly sit anywhere from 79% to essentially 100%. A sample of 100 narrows that to about plus or minus 5.9 points. A thousand comparisons gets you to roughly plus or minus 1.9. The interval shrinks with the square root of the sample, which means buying one more decimal place of precision costs a hundred times the judgements. This is why platforms built on pairwise preference run at scale: Chatbot Arena reported having amassed over 240,000 votes for ranking models against each other.
How wide the interval
Reporting n without the interval leaves the reader to compute it, and reporting neither is the norm. Two win rates of 90% and 86% may be indistinguishable or clearly separated depending entirely on sample size, and without intervals there is no way to tell which. A difference between two models is only a finding when their intervals do not overlap.
Which comparisons were in the set
A win rate describes performance on the distribution you sampled. If the comparison set over-represents prompts the model was tuned for, under-represents the long tail, or excludes cases where both outputs are poor, the number describes that construction rather than general preference. Describing the set is what makes the figure transferable, and it is the disclosure most often missing. The same discipline applies when keeping a benchmark meaningful as models change, since a fixed set stops representing the distribution as the model moves.
Who judged, and how much they agree with each other
This is the disclosure that decides how to read everything else, and it is almost never present. A win rate collected from domain experts and one collected from a general crowd panel are different measurements wearing the same label, and the gap between them widens exactly as the judgement gets more specialized. The next section works through why the reference population sets a ceiling on what any win rate against it can establish.
Why the reference matters more than the margin
A win rate measures agreement with a reference population. If that population does not agree with itself, there is a ceiling on what any measurement against it can mean.
The measurements available are sobering. In a HumanSignal benchmark with Custom.MT across 7,817 translation segments, two professional linguists scoring the same material agreed on roughly 72% of items. On creative comparisons the divergence is wider: research on designer preference reports a Krippendorff's alpha of 0.248 across 20 professional UI designers, with 28.5% of comparisons showing at least 96% pairwise disagreement.
Set a 90% win rate against that. If your reference population splits near evenly on more than a quarter of items, a 90% preference is either measuring something other than the contested judgement, or it was measured on a comparison set that excluded the contested cases. Both are possible, and the number alone does not distinguish them. Measuring how much your reference population agrees with itself is what makes the win rate interpretable, and it is cheap compared with the evaluation itself.
When the judge is a model
Substituting an automated judge for human raters changes the statistics as well as the cost. Published work on reporting judge-based evaluations finds that imperfect sensitivity and specificity in the judge induce bias in naive evaluation scores, and that correcting it requires a human-labeled calibration set, with confidence intervals accounting for uncertainty in both the test data and the calibration data.
That is a stronger requirement than most reported judge evaluations meet. A judge-derived win rate without calibration is a biased estimate of an unknown quantity, and the bias does not average out with more comparisons, because it is systematic rather than random. Whether the judge can settle the question at all is a separate matter, covered in whether an automated judge can be trusted with the comparison, and the known behavioural biases a model judge brings compound the statistical ones.
How to report one so it survives scrutiny
State n and the interval
Give the number of comparisons and a 95% confidence interval alongside the point estimate. This costs one line and converts an assertion into a measurement.
Describe the comparison set
Say how the comparisons were selected, what the prompt distribution was, and what was excluded. A reader cannot transfer your result without it.
Report the reference's internal agreement
Give the agreement rate among your own judges on the same items, using a coefficient that corrects for chance. This sets the ceiling against which your win rate should be read.
Separate judge scores from human scores
Keep them in different columns and label them. Merging them produces a number nobody can decompose later, and it hides exactly the substitution a reader most needs to know about.
What to ask when someone shows you one
Four questions, in order, and none requires access to their data. How many comparisons, and what is the interval. How was the comparison set built, and what did it exclude. Who judged, and how often did they agree with each other. Was any part of the judging automated, and if so was the judge calibrated against human labels.
The order matters, because the answers interact. A large sample with a narrow interval means nothing if the comparison set was built to favour one side, and a well-constructed set judged by a population that cannot agree with itself produces a precise estimate of something unstable. Work down the list rather than stopping at the first satisfactory answer.
A win rate that survives all four is evidence. One that survives none of them is a number, and the distinction matters most when the figure is being used to justify a decision rather than to report a result. The same reasoning applies to your own internal evaluations, where separating a real movement from measurement noise is the difference between shipping a fix and chasing a phantom.
Build the evaluation so the number means something
A win rate is only as good as the reference behind it, which means collecting enough human judgement to establish a baseline and keeping judge scores separable from human ones. Label Studio Enterprise supports multi-reviewer assignment, agreement analytics, and model-assisted scoring in one workflow, so the sample size, the interval, and the reference agreement all come out of normal review. Take a look at the platform if you are building this measurement now.
How many comparisons does a win rate need?
Enough that the confidence interval is narrower than the difference you are trying to detect, which depends on the size of that difference rather than on a fixed target. At a 90% rate, 100 comparisons gives roughly plus or minus 5.9 points and 1,000 gives roughly plus or minus 1.9. If you are trying to establish a three-point improvement, the first sample cannot do it and the second can.
What confidence interval should be reported?
A 95% interval is the common convention and is adequate for most reporting, computed as the estimate plus or minus 1.96 standard errors for a binomial proportion. The important part is reporting one at all, since the point estimate alone gives a reader no way to judge whether two results differ. For very high or very low rates with small samples, the simple approximation degrades and a method designed for extreme proportions is worth using.
Does a 90% win rate mean the model is better?
It means judges from the recruited population preferred one output on the sampled comparisons, which may or may not generalize. Whether it indicates a better model depends on how representative the comparison set was and whether the reference population agrees with itself on the items in question. Where the reference is internally divided, a very high win rate more often indicates a comparison set that excluded contested cases.
Can an LLM judge produce a trustworthy win rate?
It can produce a usable one if it is calibrated against human labels and the reported interval accounts for uncertainty in both the test and calibration data. Without that, published work indicates the judge's imperfect sensitivity and specificity bias the score systematically, and more comparisons do not remove a systematic bias. Treat an uncalibrated judge win rate as a ranking signal rather than a measurement.
How do I compare two win rates from different papers?
Usually you cannot, because the comparison sets and judge populations differ and a win rate is defined relative to both. Even with identical models, a different prompt distribution or a different rater pool produces a different number. The only sound comparison is one you run yourself with a fixed set and a fixed pool across both systems.
What should I ask a vendor who quotes one?
Ask for the number of comparisons and the confidence interval, how the comparison set was constructed and what it excluded, who judged and what their agreement with each other was, and whether any judging was automated and calibrated. A vendor who has the answers will give them readily. A vendor who treats the questions as unusual has told you something useful about the number.
Related Content
-
How to build a red teaming dataset
Learn how to build a red teaming dataset with a reusable schema, three sourcing tiers, expert annotation, and a maintenance workflow that keeps your model's safety coverage current.
-
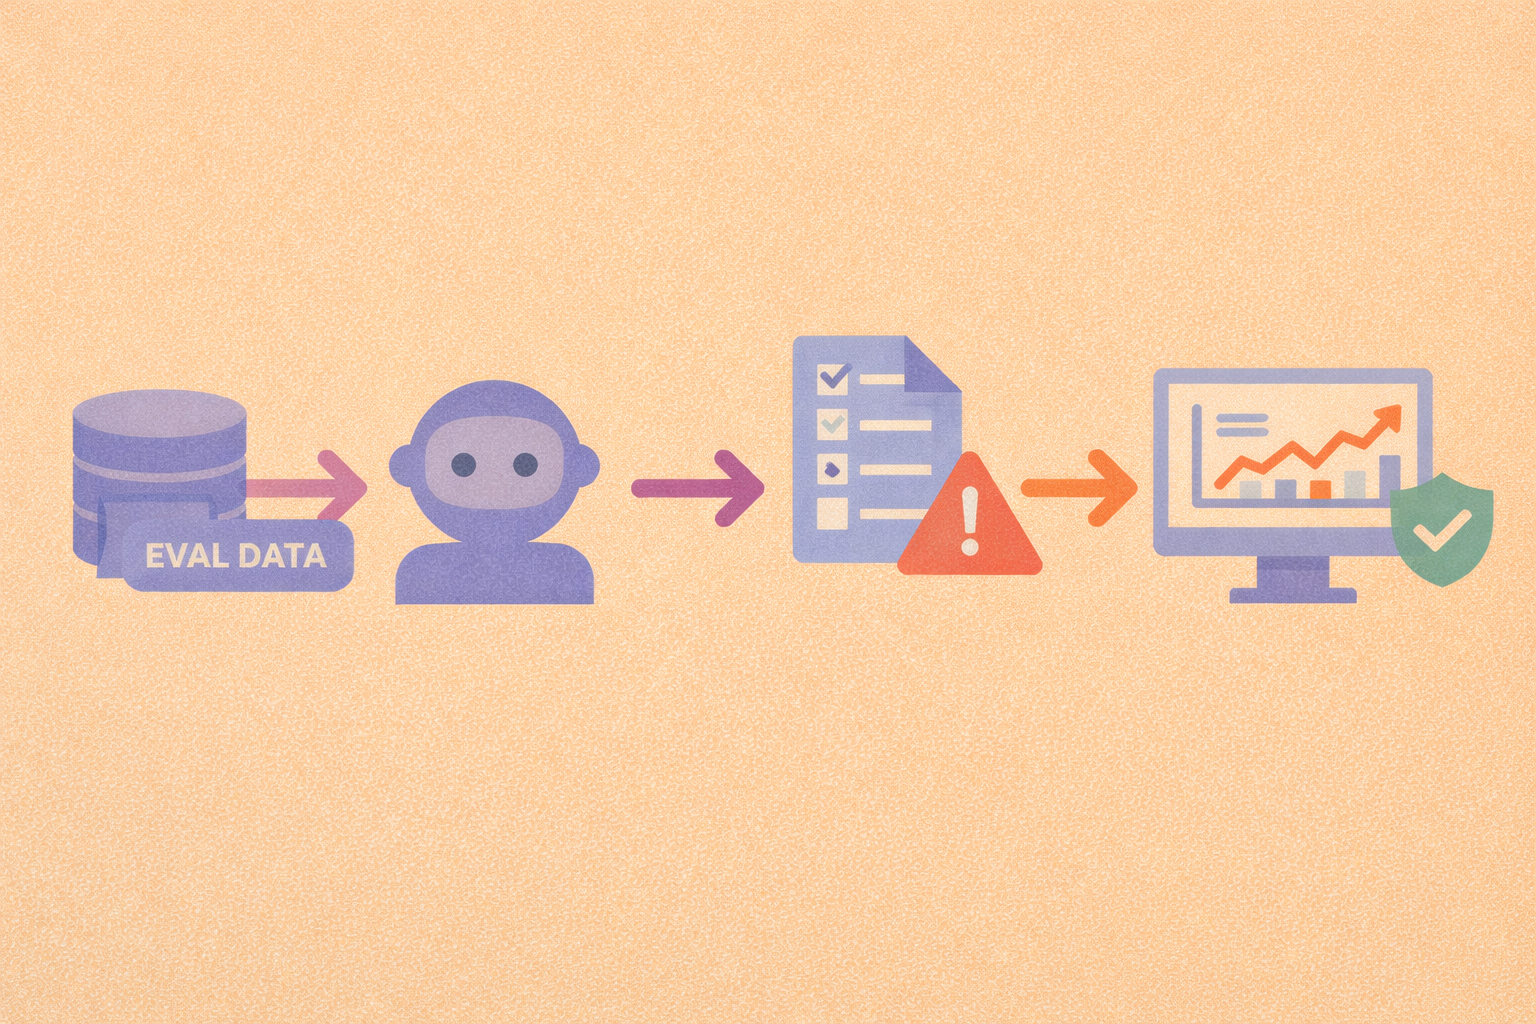
How to Set up AI Evaluation Pipelines in a Machine Learning Workflow
Evaluation pipelines turn model testing into a repeatable habit, making performance changes and failure patterns easier to catch early.
-

Few‑Shot Learning: Train AI with Just a Few Examples
Few‑shot learning empowers AI systems to generalize from only a handful of labeled samples. It's a game-changer for settings with limited data, slashing resource needs and accelerating deployment.
-

Step-by-step guide to AI evaluation in machine learning projects
A structured evaluation workflow helps you move from raw metrics to confident decisions about model quality, risk, and readiness.
-

Best AI evaluation platforms with collaboration features for teams
Once evaluation involves multiple reviewers and stakeholders, permissions, review workflows, and audit trails matter as much as the metrics.
-
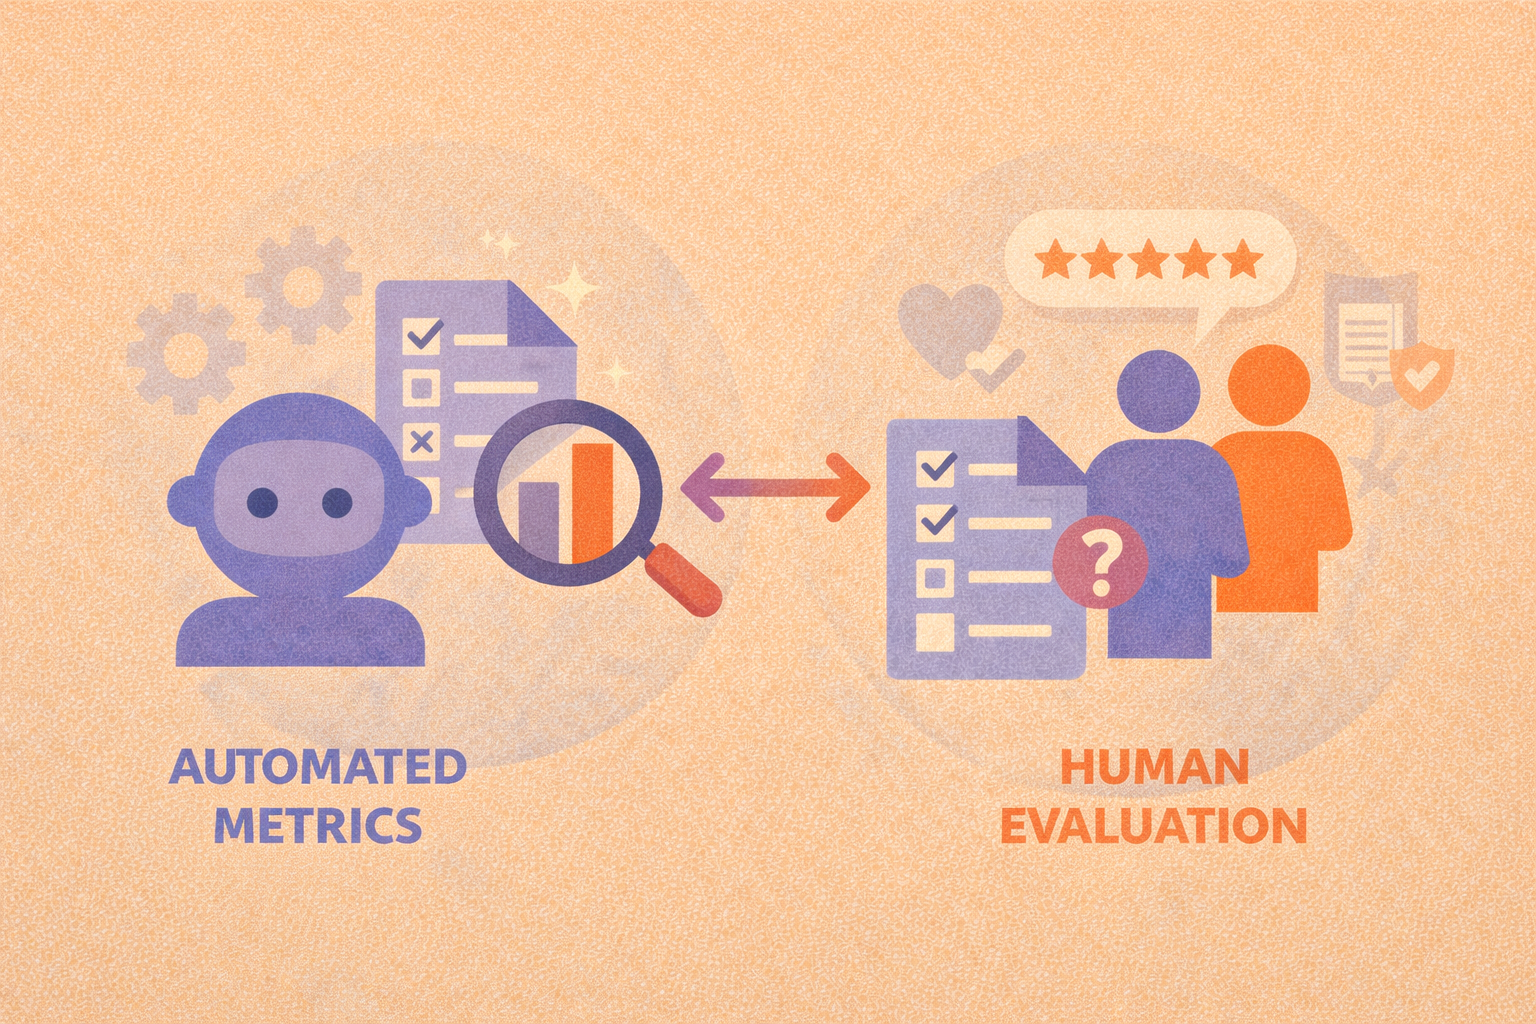
Automated metrics vs human evaluation: when each is the right choice
Automated metrics provide scale and consistency, while human evaluation captures nuance, effective AI evaluation programs rely on both.
-

How to Evaluate AI Models Effectively
AI model evaluation isn’t just about accuracy. Learn how to evaluate your models across key dimensions like reliability, bias, and real-world performance.
-

The Complete Guide to Evaluations in AI
Evaluating an AI model isn’t just about checking accuracy, it’s about building trust. This guide explores the full spectrum of evaluation methods, from metrics to human-in-the-loop reviews and LLM-based scoring.
-
ReCode Robustness Evaluation of Code Generation Models: What It Is and Why It Matters
What happens when a code generation model sees slightly modified inputs? ReCode is a benchmark designed to evaluate exactly that—how robustly these models handle variation in the wild.
-
Can an LLM judge score creativity?
What the measurements show about automated judges on creative output, where a judge earns its place, and where it cannot settle the question at all.
-
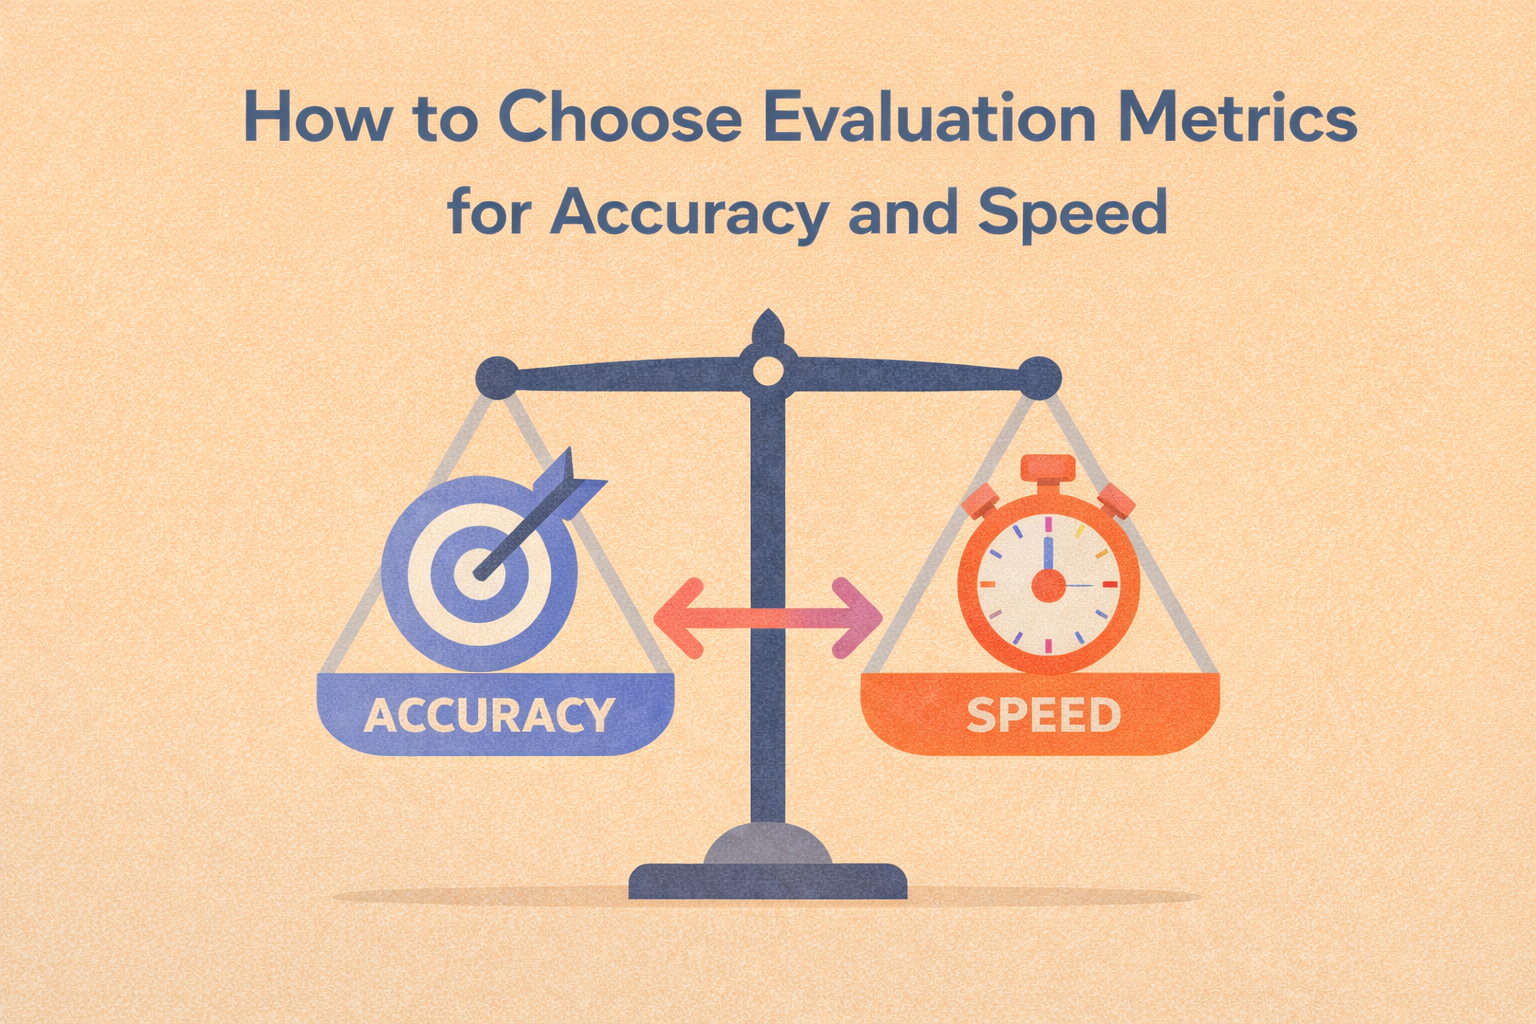
How to Choose Evaluation Metrics for Accuracy and Speed
The right evaluation metrics make accuracy–speed tradeoffs visible so you can optimize for what actually matters in production.
-

Why Explainability Matters in AI Evaluation
This blog explores how explainability and interpretability fit into AI evaluations, helping teams build trust, spot hidden flaws, and ensure ethical performance.
-

AI Evaluation for NLP: What to Use (and When)
NLP evaluation often needs more than automated scores. This guide explains three common tool paths—structured human review, app-layer LLM evaluation, and programmable scoring—and when each fits best.
-
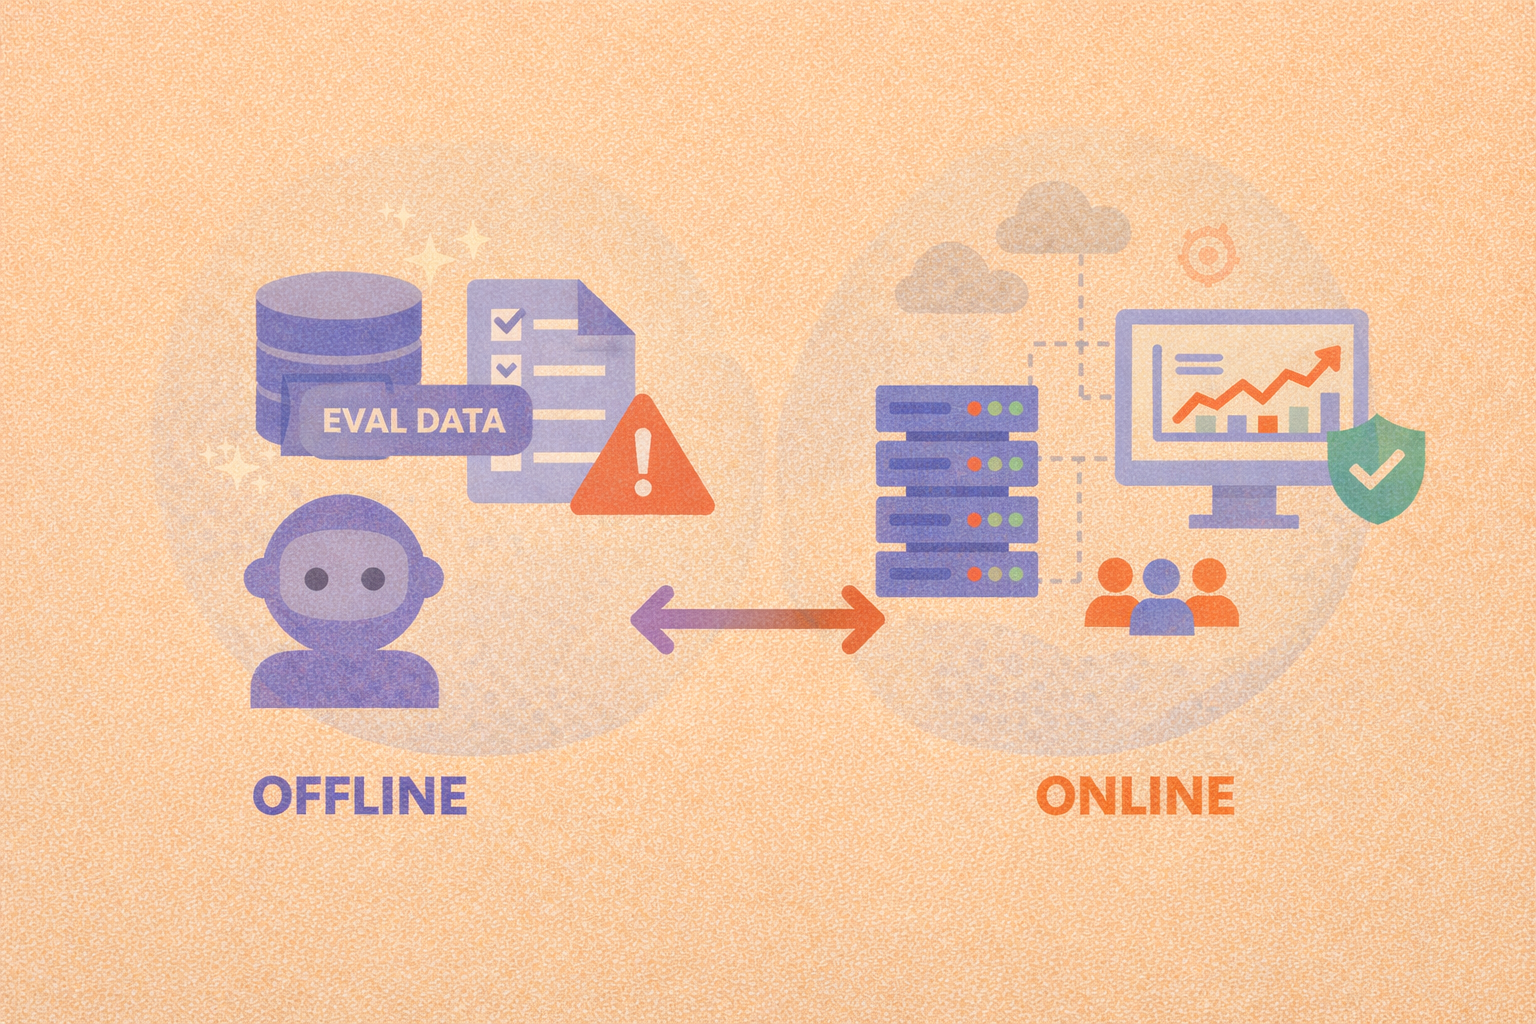
Offline evaluation vs online evaluation: when to use each
Offline evaluation enables fast, repeatable model comparison, while online evaluation confirms whether those gains hold up under real-world conditions.
-
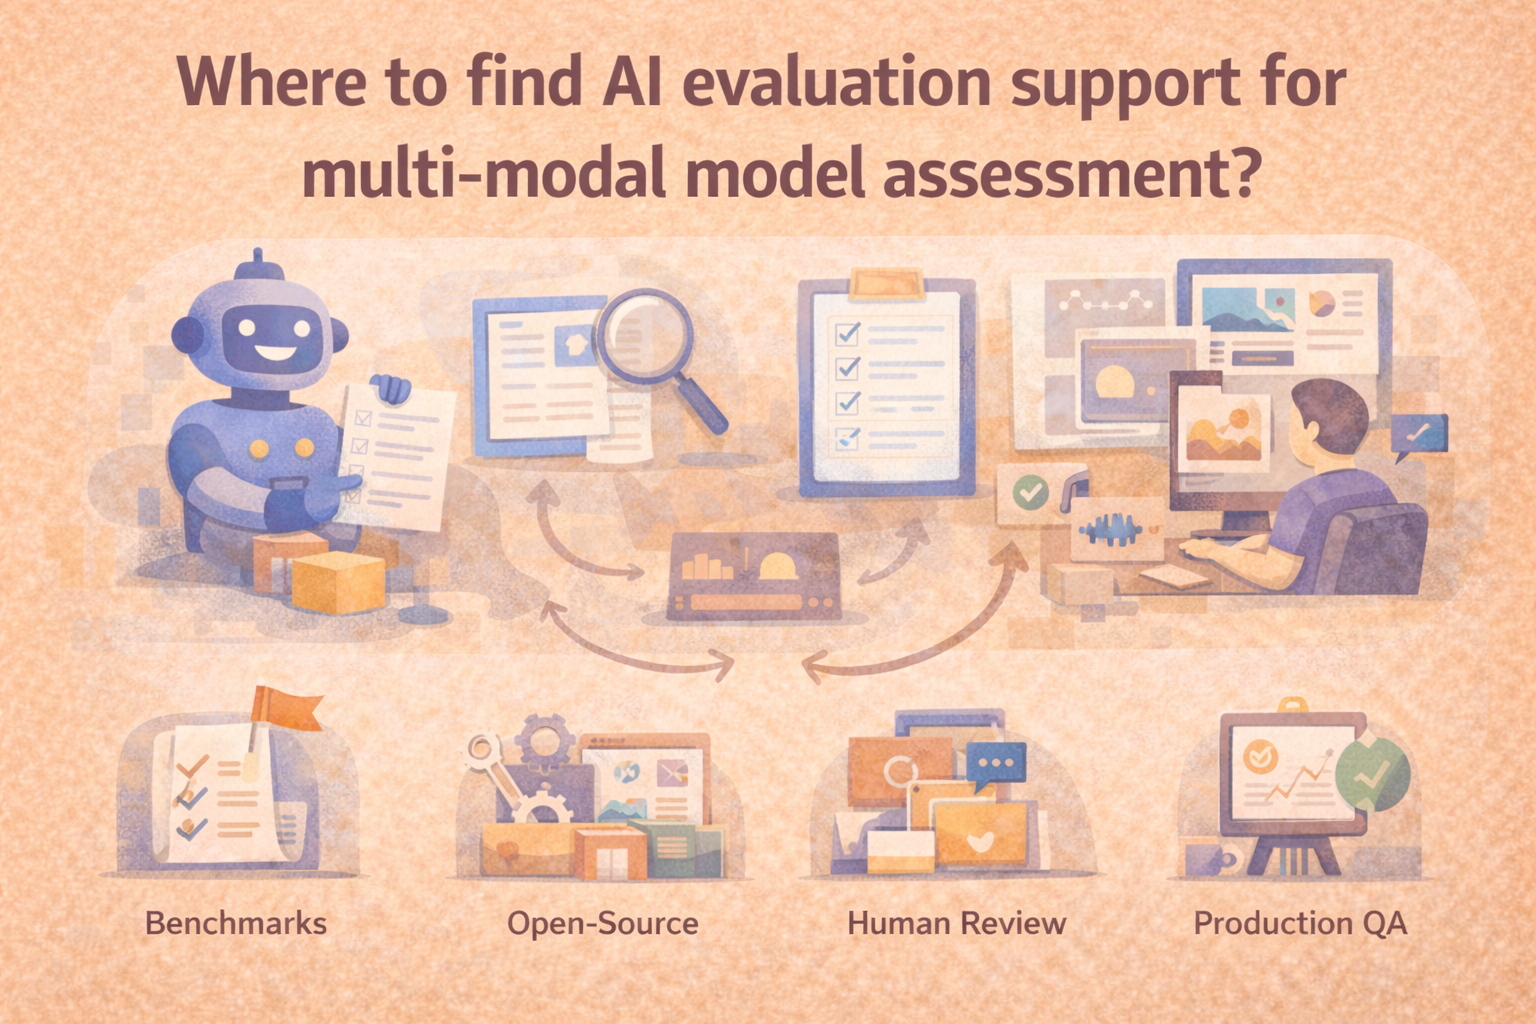
Where to find AI evaluation support for multi-modal model assessment
The right starting point depends on whether you need offline benchmarking, structured human review, regression testing, or real-world monitoring.
-
Human-in-the-Loop Evaluations: Why People Still Matter in AI
Human-in-the-loop (HITL) evaluations bring expert oversight into AI workflows. Learn where humans add value, how to scale review, and when it matters most.
Let me know if you'd like a hero image or a CTA linking this to your evaluations pillar page.
-
How to Automatically Catch Mistakes from Large Language Models
Evaluating the quality of large language model (LLM) outputs isn't one-size-fits-all. This guide breaks down four key methods, reference comparison, LLM-as-a-judge, rule-based checks, and classifiers, to help you automatically detect common errors like hallucinations, bias, and off-topic responses. Learn when and how to apply each method effectively.
-

AI Governance and Compliance: Why Evaluations Are the Missing Link
Without strong evaluation workflows, compliance with ethical and legal standards is impossible to verify, let alone enforce. Here’s how to close the gap.
-

This hub explores the full spectrum of evaluation methods, from metrics to human-in-the-loop reviews and LLM-based scoring across multiple articles.
-

Machine Learning Evaluation Metrics: What Really Matters?
Accuracy isn’t everything. Learn how precision, recall, F1 score, and more help you measure what really matters in machine learning model performance.
-

Understanding Model Accuracy: How to Evaluate Your AI
Accuracy is one of the most common metrics in machine learning evaluation, but it’s also one of the most misunderstood. Here’s how to use it wisely.
-

How to Get Demos of AI Evaluation Software Before You Buy
This guide explains how to prepare the right sample outputs, define structured review criteria, ask the right integration questions, and compare tools clearly before you buy.
-
How to Monitor AI Performance in Production: A Guide to Continuous Evaluation and Drift Detection
AI models don’t stop learning after deployment, but that doesn’t mean their performance stays reliable. This guide covers how to monitor your models in the real world, detect drift, and maintain accuracy over time.
-

Popular AI evaluation APIs for developers
AI evaluation APIs make it easier to run repeatable tests, track results over time, and catch regressions, as long as you design the workflow around versioning, traceability, and meaningful metrics.
-

What AI evaluation platforms specialize in assessing generative AI models?
GenAI evaluation works best when teams can review multi-turn outputs with consistent rubrics, shared workflows, and reliable governance.