Data Labeling: The Unsung Hero Combating Data Drift
Authored by Dr. Sundeep Teki.
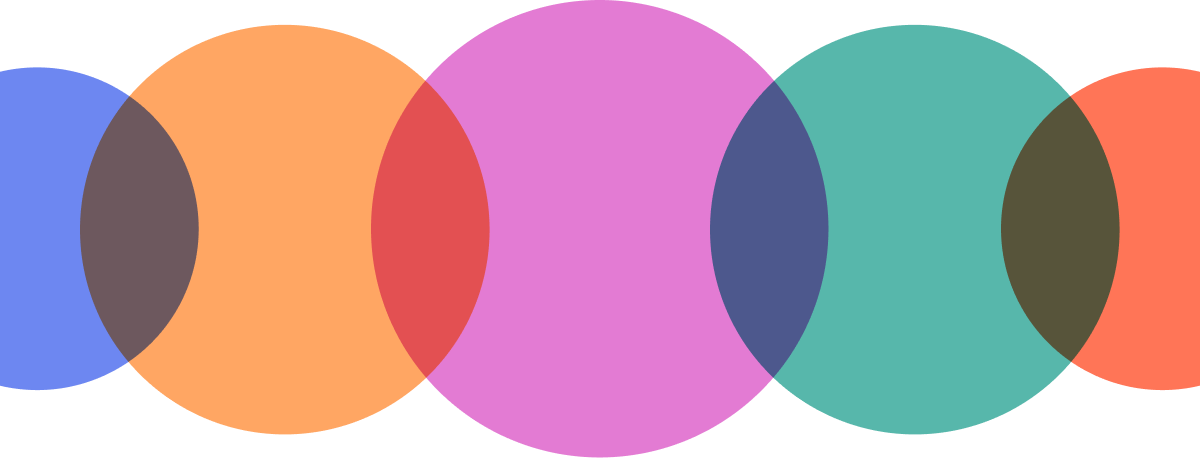
Data drift is a common problem for production machine learning systems. It occurs when the statistical characteristics of the training (source) and test (target) data begin to differ significantly. As illustrated in the image below, the orange curve depicting the original data distribution shifts to the purple curve, representing a change in statistical properties like the mean and variance.
Consequently, a machine learning model that initially performed well on the original data (the orange curve) now fails to match its earlier predictive accuracy on the new data distribution (the purple curve).
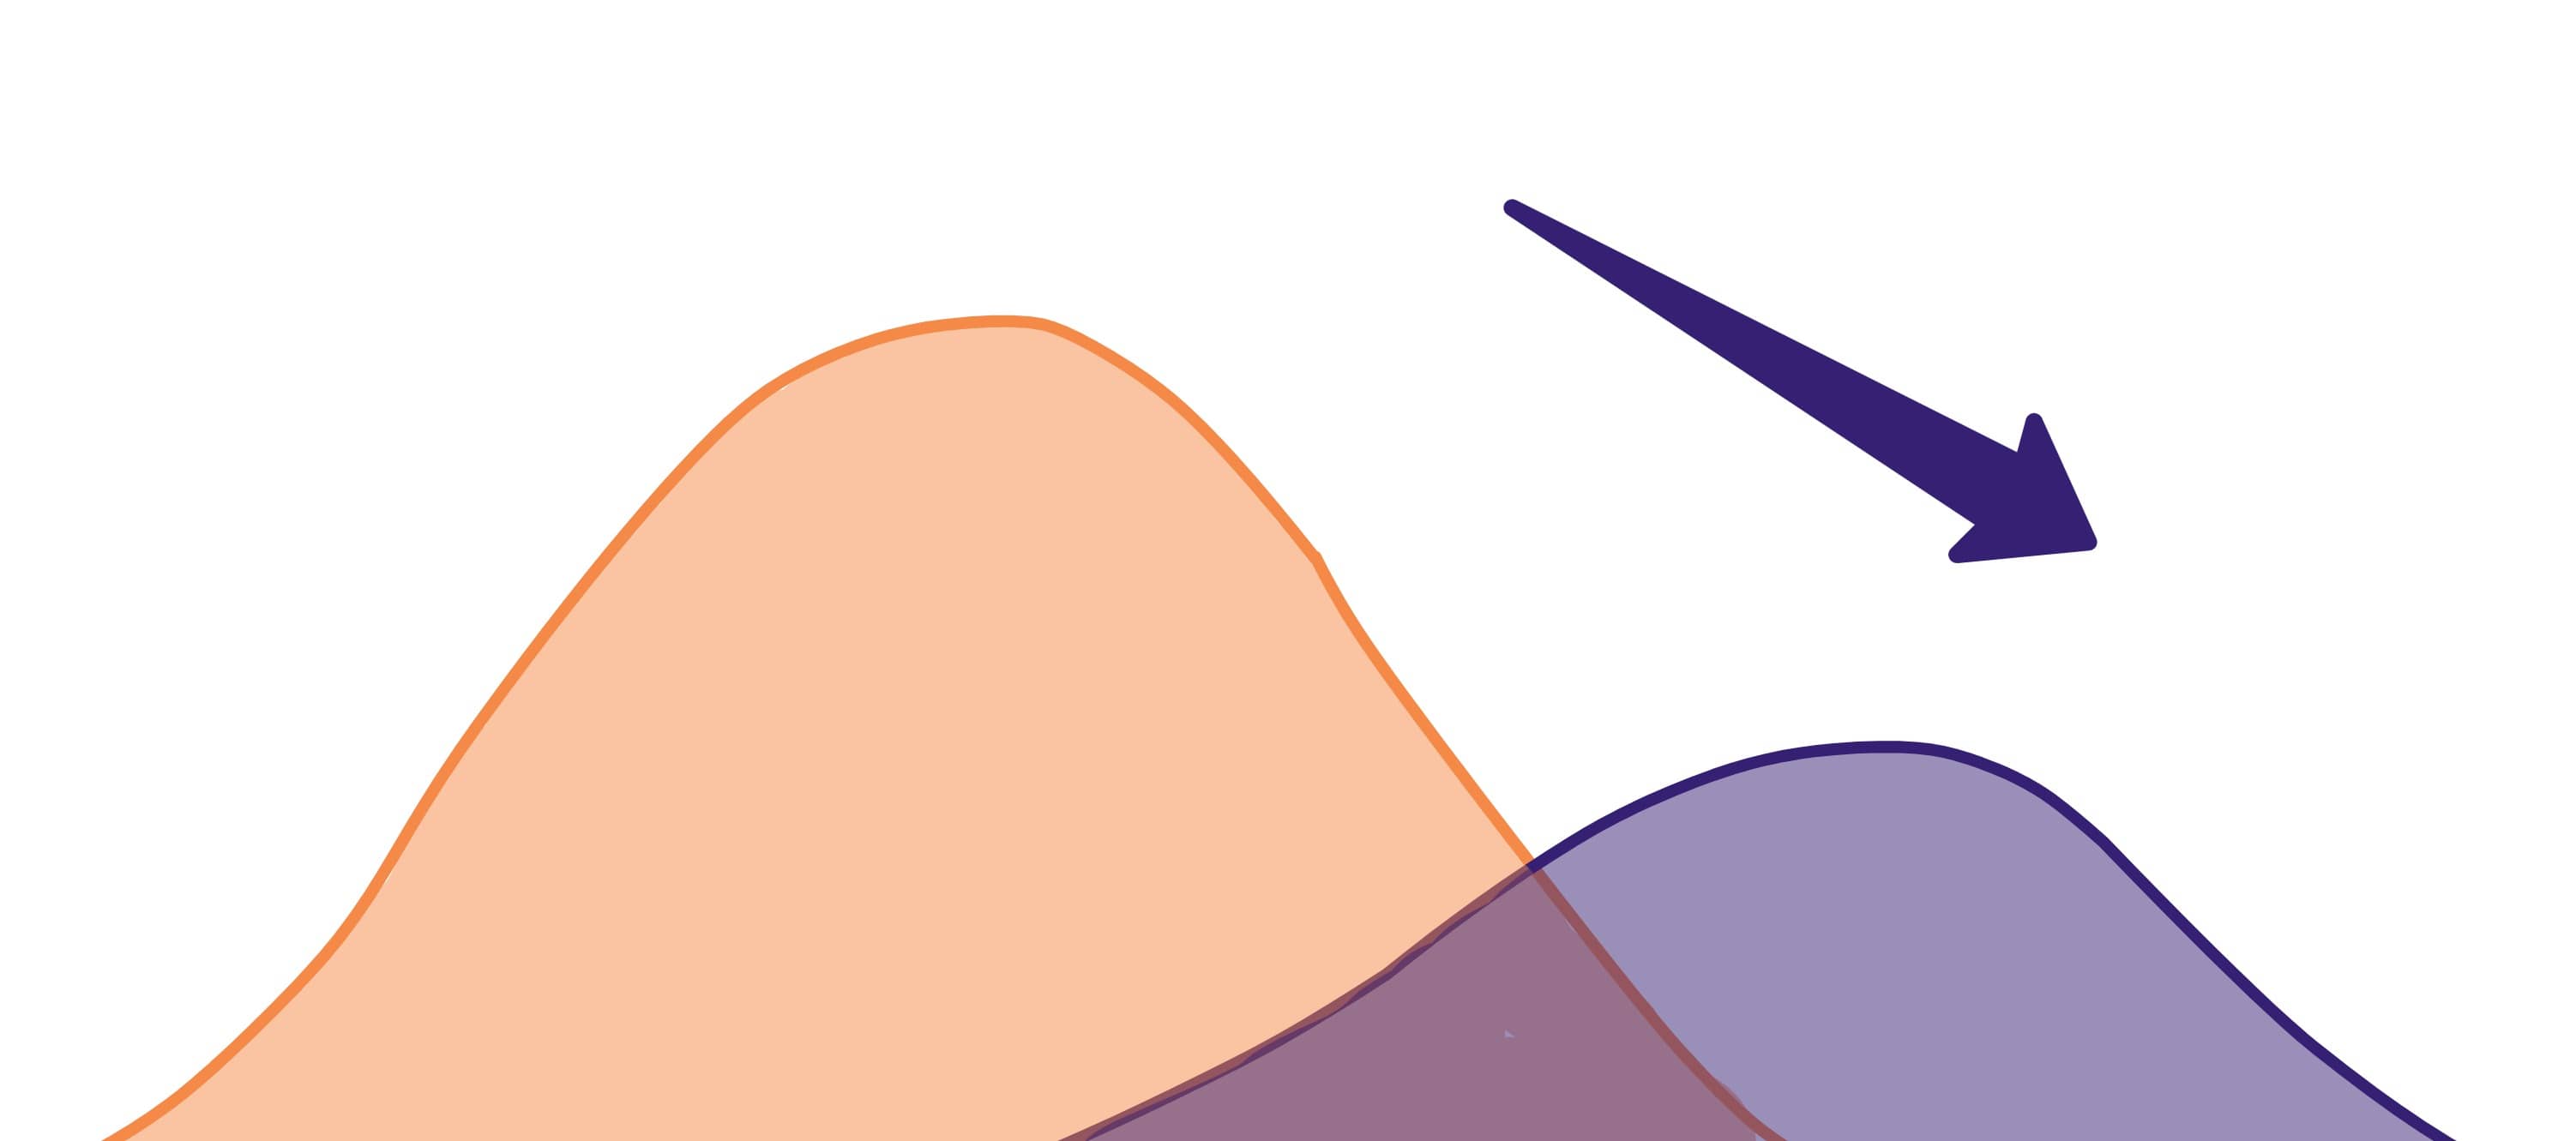
Data drift is caused by changes in the distribution of data. Graphic based on an image from the Evidently AI blog post on Why You Should Care About Data and Concept Drift.
Understanding data drift is fundamental to maintaining the predictive power of your production machine learning systems. For instance, a data science team may have started working on a machine learning use case in 2019, using training data from 2018, but by the time the model is ready to go into production, it’s 2020. There could be a huge change in the distribution between the source data from 2018 and the live data coming from 2020.
Any time a machine learning model is ready to be shipped, it needs to be rigorously tested on live data. It’s critical that you detect data drift before deploying a model to production.
In this article, I’ll illustrate the various types of data drift and how data drift impacts model performance along with several examples. I’ll also address data labeling, one of the popular ways to tackle data drift, and how to perform data labeling efficiently.
Why Data Drift Happens
In real-world situations, data drift can occur due to a variety of reasons:
- seasonal trends
- launch of a new feature or product that causes a change in the data or features used to train the machine learning model
- rare black swan events like the COVID-19 pandemic that disrupted normal customer behavior in specific domains like food, travel, and hospitality
Continuing with the COVID-19 example, a model trained on data prior to the onset of global lockdowns, say from January to February 2020 will yield poor predictions on data in March and April 2020 after the lockdowns started. Thus, the original trained model is no longer relevant or practically useful and needs to be retrained.
Even small changes in the data structure or format of the source data can have significant consequences for machine learning models. For instance, a change in the format of a data field, like an IP address or hostname or ID, can often go undetected for a long time without effective root cause analysis.
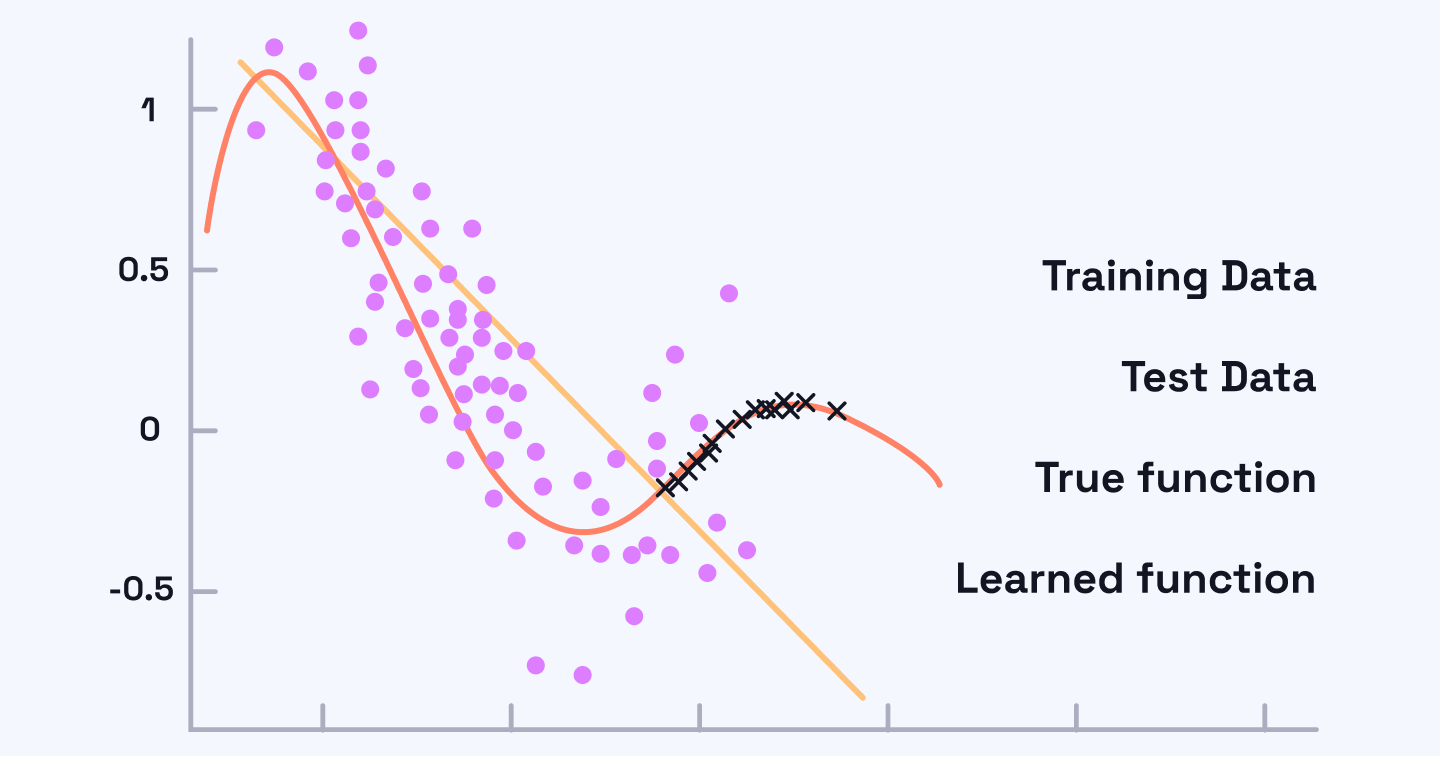
The following image illustrates how data drift occurs. The blue dots represent the source or training data samples collected at a particular point in time.
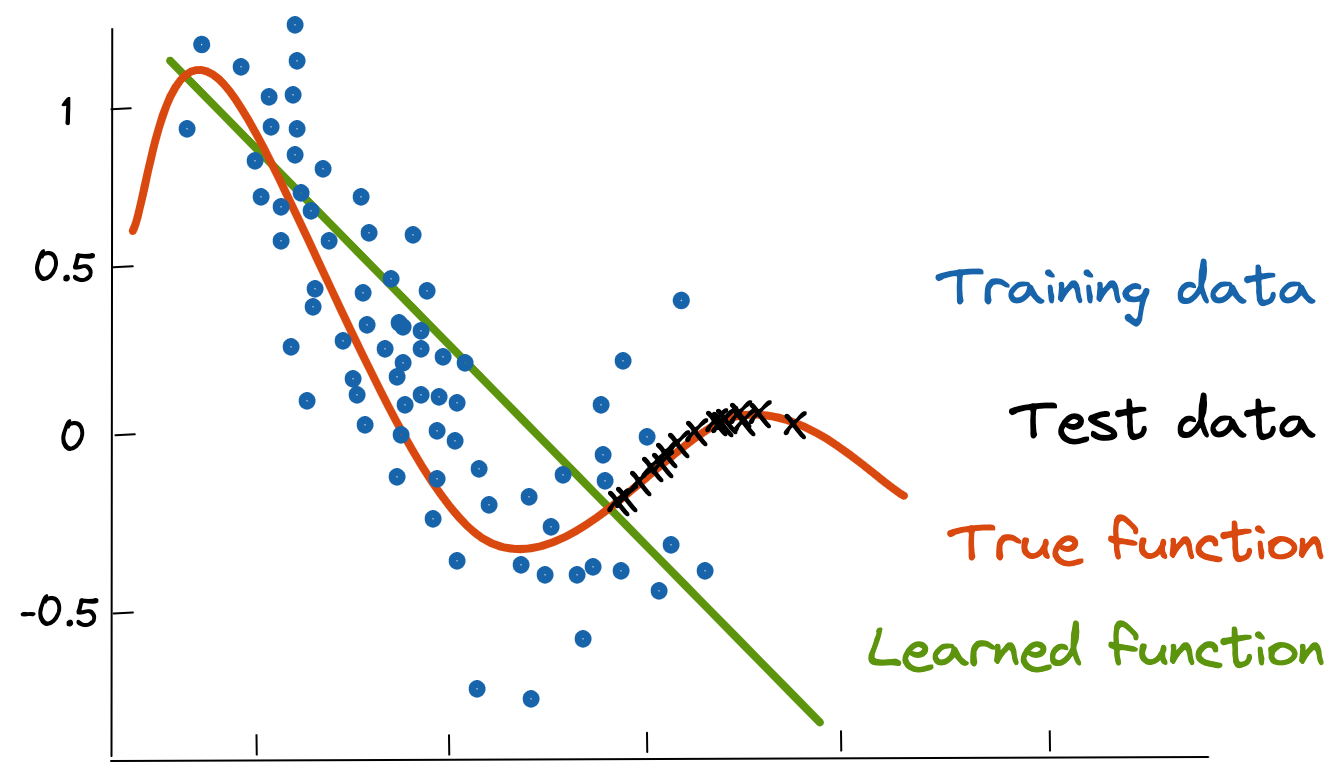
The original machine learning model learns a function (green line) that captures the distribution of the training data (blue dots). However, at the time of testing, the distribution of data has changed, as reflected by the test data (black crosses). Therefore, the original learned function will not perform as well as the true function (red curve). This image is modeled after a study for the University of Granada.
In this case, we can assume a regression use case where the goal is to predict the value of a continuous target variable. The green line represents the best fit of a regression model trained on the training samples. However, due to data drift, the test samples in black no longer follow the same distribution as the original training data. Consequently, the previously trained machine learning model does a poor job of predicting the test samples, which no longer lie close to the green regression line.
The data distribution has changed from linear to nonlinear, and a straight line is a poor predictor. The best fit to the new data distribution follows a nonlinear curve shown in red.
It can be challenging to detect data drift, but machine learning teams must make it a priority to troubleshoot and identify sources of data drift and rectify them.
Types of Data Drift
There are different types of data drift, but the two principal ones are:
- covariate drift
- concept drift
Covariate drift refers to data drift associated with a shift in the independent variables. It happens when a few features change while still maintaining the same relationship between the feature and the target variable.
Covariate drift primarily occurs due to sample selection bias, which is a systematic bias in the selection of training data that results in a nonuniform and nonrepresentative training dataset. Nonstationary environments, where the training environment differs from the test environment, also cause covariate drift.
Concept drift, on the other hand, occurs when the relationship between the independent variables and the target variable changes.
Consider a product recommendation machine learning model in the context of e-commerce, where the original model is trained on user activity and transactions from users located in the US. Now imagine that the e-commerce company is going to launch in a new locale or market with the same product catalog as in the US. The original recommendation model will perform poorly when applied to users from the new market with significantly different online shopping behavior, financial literacy, or internet access for e-commerce.
In this example, the online shopping behavior of the users is markedly distinct. Even if the same features are used to train the machine learning model, it might underperform significantly. In such cases, concept drift is the root cause of data drift, and the personalization model needs to be reworked and include new features that better capture the new user behavior.
Overcoming Drift with Data Labeling
To overcome data drift, you need to retrain the model using all available data, including data from before and after drift occurred. New data needs to be labeled accurately before including it in the new training dataset.
Data labeling refers to the process of providing meaningful labels to target variables in the context of supervised machine learning where the target could be an image or text or an audio snippet.
In the context of data drift, data labeling is crucial to countering data drift, and thereby directly affects the performance of machine learning models in production.
Data labeling is integral to supervised machine learning where a model is fed input data along with relevant labels depending on the use case. For example, for a model learning to detect product placement in videos, the model is fed a video with products highlighted in the video.
Typically, data labeling is a manual exercise that’s both costly and time-consuming. It’s often outsourced to vendors in developing countries associated with low cost of labor. Annotators need to be trained to use labeling software, understand the machine learning use case and the annotation framework, and deliver highly accurate labels at a high velocity and throughput.
In such a scenario, labeling errors can occur, which exacerbates the problem of data drift if data from the new test or target distribution isn’t labeled accurately. In practice, several controversial labeling errors have occurred that cause reputational damage to the company, for instance, when Google Photos labeled two Black people as “gorillas.”
Big technology companies like Google and Facebook are grappling with such issues in their automated data labeling algorithms. Labeling errors can be made by human annotators, and also by machine learning models. Once trained, the predictions made by machine learning models on new data are often reused to augment the original training data to further improve the models. In such scenarios, data labeling errors can compound resulting in imperfect models that often yield such bizarre and controversial results.
Data labeling helps alleviate data drift by incorporating data from the changed distribution into the original training dataset.
Referring back to the previous image, this means that all the test samples (black crosses) need to be labeled and included in an expanded training dataset along with the blue dots to help reduce the difference in statistical properties of the training and the test datasets. If enough new data is labeled, then it is possible to drastically reduce data drift by simply dropping the older data and only using the newly labeled data.
Therefore, proper and efficient data labeling is a crucial exercise with significant commercial impact, depending on the nature of the machine learning application. For example, incorrect data labels in a fraud detection use case can result in monetary loss every time the fraud detection machine learning model makes an incorrect prediction. Inaccurate data labels not only impact the performance of the machine learning model but also indirectly contribute to data drift. Any systematic data labeling errors may compound the problem as the model’s predictions on new data are typically leveraged to augment the training dataset.
Data labeling can be improvised and performed effectively through the use of intuitive software that enables human annotators to label data with high speed and low cognitive load. For additional improvement in data labeling, you can implement inter-annotator agreement; a particular training example is assigned a label that’s selected by a majority of the annotators. For example, if four out of seven annotators assign “Label1” to a particular data sample and the other three annotators assign it “Label2,” then the data sample would be tagged with “Label1.”
Strong operational practices including auditing of randomly selected labels for accuracy can improve the process and provide feedback about systematic labeling errors.
You can also use machine learning to aid data labeling with a model trained on a sample of data that’s labeled by humans to generate predictions on new or unlabeled data. These noisy labels can then be leveraged to build better machine learning models by incorporating the data samples associated with high probability and sending the data samples with low probability back to human annotators for more accurate labels. This process can be repeated iteratively to improve the overall performance of the model with minimal human data labeling efforts.
Conclusion
Data drift can have a negative impact on the performance of machine learning models as data distribution changes. This can cause a machine learning model’s predictive accuracy to go down over time if not countered effectively.
Data labeling is one technique to reduce data drift by applying labels to data from the new or changed distribution that the model does not predict well. This helps the machine learning model to incorporate this new knowledge during the training process to improve its performance.
There are several tools available today that enable annotators to label data efficiently. For example, Label Studio is an open-source data labeling tool that provides a platform for labeling different data types, including images, text, audio as well as multi-domain data. It’s already used by leading technology companies including Facebook, NVIDIA, Intel, so check it out if you’re looking for a robust, open-source solution for reducing data drift.
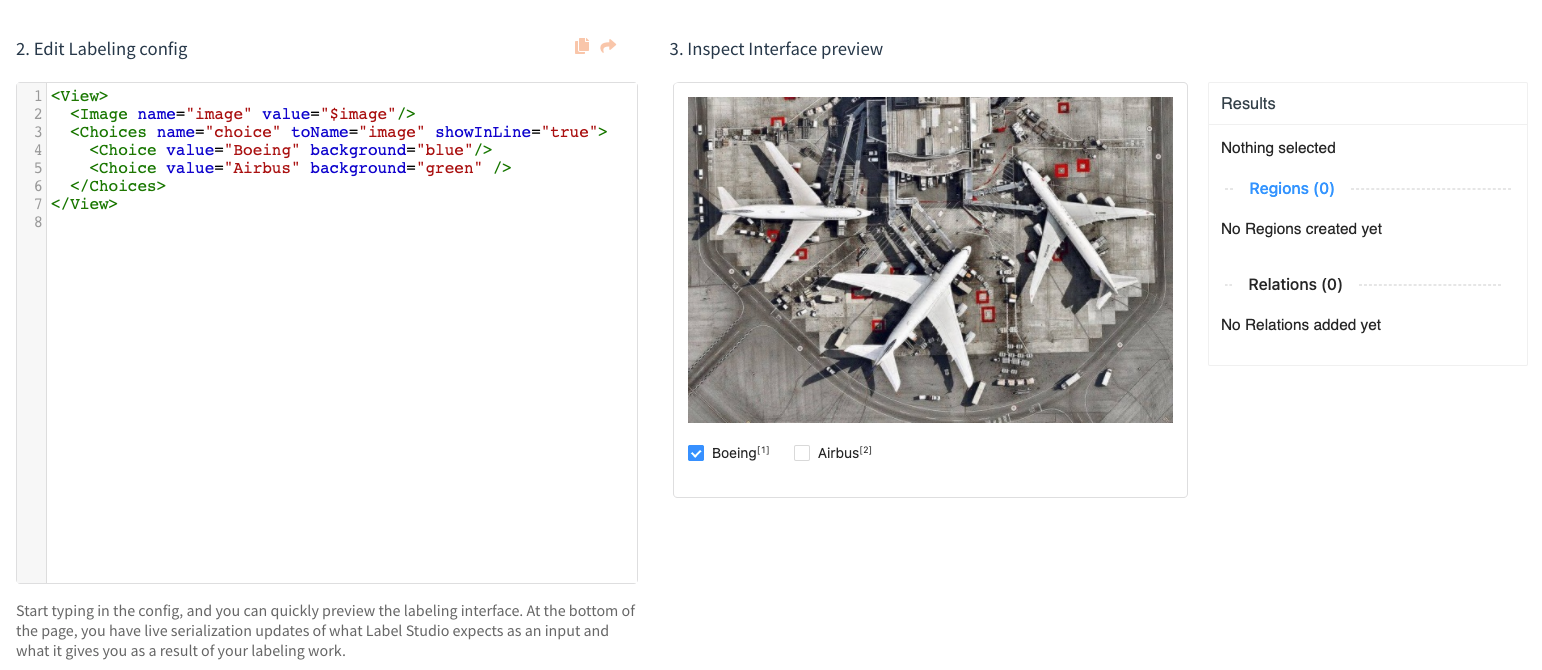
Screenshot of Label Studio for an Image Classification data labeling example.
Related Content
-

The 5 Metrics That Actually Move AI Into Production
A practical framework for turning AI metrics into clearer decisions about what to fix, ship, and scale.

Sheree Zhang
April 15, 2026
-
Scaling AI Data Quality: Best Practices for Onboarding and Evaluating Annotators
A practical workflow for onboarding and evaluating annotators with clear instructions, calibration, quality gates, reviewer feedback, and dashboards that keep labeling consistent as volume grows.

Alec Harris
March 12, 2026
-
How to Create a Prompt Generator with Label Studio and RLVR
In this article, you'll learn how to apply an RLVR-based score verifier and use an LLM as a prompt optimizer to enhance your prompts.

Label Studio Team
March 2, 2026