How to Use Krippendorff’s Alpha to Measure Annotation Agreement

As a part of our inter-annotator agreement series, we’re digging into one of the most flexible and widely applicable metrics out there: Krippendorff’s alpha.
If you're working with labeled data and need to evaluate how consistently your annotators are interpreting the task, this is the metric to know. Compared to other agreement metrics like Cohen’s kappa or Fleiss’ kappa, Krippendorff’s alpha offers more flexibility—and is better suited for real-world data annotation workflows.
What Is Krippendorff’s Alpha?
Krippendorff’s alpha is a dataset-level metric used to quantify inter-rater reliability. Unlike other agreement measures, it:
- Works with any number of raters
- Handles incomplete data
- Supports nominal, ordinal, interval, and ratio data types
This makes it particularly useful for messy, real-world datasets where not all annotators rate every item or where the labels span beyond simple yes/no categories.
The Formula
The general formula for Krippendorff’s alpha is:
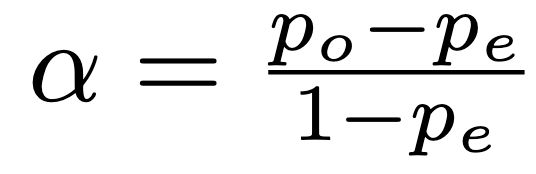
This might look familiar—it’s the same structure used by other kappa statistics. The difference lies in how you calculate the observed and expected agreement, especially depending on the data type (nominal, ordinal, interval, etc.).
Step-by-Step Example
Let’s walk through a basic example with nominal data to keep it simple.
Scenario Setup
| Rater 1 | Rater 2 | Rater 3 | Rater 4 | |
| Item 1 | 4 | 3 | 4 | 4 |
| Item 2 | 1 | 1 | 1 | |
| Item 3 | 3 | 3 | ||
| Item 4 | 5 | 4 | 5 | 4 |
| Item 5 | 1 | 2 | 3 | 4 |
| Item 6 | 5 | 4 | 3 | |
| Item 7 | 2 | 2 | 3 | 1 |
| Item 8 | 3 | 3 | 2 | 4 |
| Item 9 | 2 | 1 | ||
| Item 10 | 4 |
Suppose you have 4 annotators labeling 10 items using a 1 to 5 rating scale as shown above. One item, item 10, only received one rating, so it’s removed from the dataset—leaving us with 9 items to analyze.
We let:
- n = 9 (number of items)
- q = 5 (number of rating categories)
- rik = number of times item i received rating k
- r̄ = average number of raters per item
You’ll create a table that counts how often each item received each score from 1 to 5. Then sum those to get the total ratings per item and calculate the average across all items.
| Item (i) | Rating Category (k) | |||||
| 1 | 2 | 3 | 4 | 5 | Total (ri) | |
| Item 1 | 0 | 0 | 1 | 3 | 0 | 4 |
| Item 2 | 3 | 0 | 0 | 0 | 0 | 3 |
| Item 3 | 0 | 0 | 2 | 0 | 0 | 2 |
| Item 4 | 0 | 0 | 0 | 2 | 2 | 4 |
| Item 5 | 1 | 1 | 1 | 1 | 0 | 4 |
| Item 6 | 0 | 0 | 1 | 1 | 1 | 3 |
| Item 7 | 1 | 2 | 1 | 0 | 0 | 4 |
| Item 8 | 0 | 1 | 2 | 1 | 0 | 4 |
| Item 9 | 1 | 1 | 0 | 0 | 0 | 2 |
| Average (r̄) | 3.33 | |||||
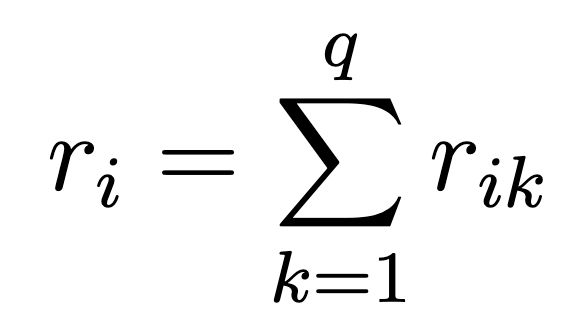
ri is the number of ratings each item received, i.e.
Step 1: Choose a Weight Function
Krippendorff’s alpha requires you to define an agreement metric between rating categories.
For nominal data:
- Ratings are considered equal only if they match exactly
- Disagreements are weighted as 0, matches as 1
You can also define ordinal or interval weight functions for more complex scoring systems, but we’ll keep it simple here.
Step 2: Observed Agreement (Po)
Observed agreement is the average agreement across all rated items, normalized by the number of raters and label options. We’ll use this formula:
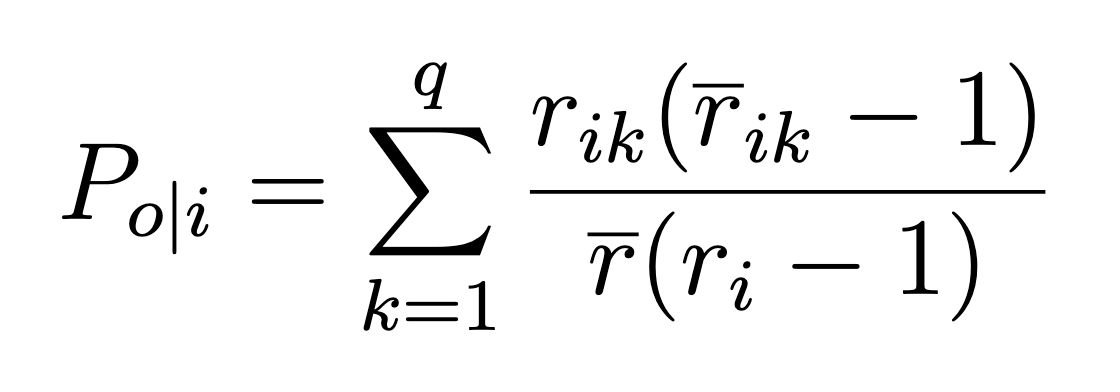
For each item i:
- Take the number of times raters agreed on a category, and multiply by the number of raters who picked that category minus 1
- Normalize using the average raters per item and the number of raters who rated that item
- Sum the results across all rating categories
Let’s work through this part of the example for the first item. We’ll replace rik with the value in the table for each item i and rating k, and sum these results. For the first item, we get:

We do this for every row in the table and sum the results
6 + .9 + .6 + .4 + 0 + 0 + .2 + .2 + 0 / 9 = .322
Finally, we calculate our observed agreement by plugging the average observed agreement into this formula. Essentially, nr̄ works out to be the total number of ratings in the dataset, in this case 30.
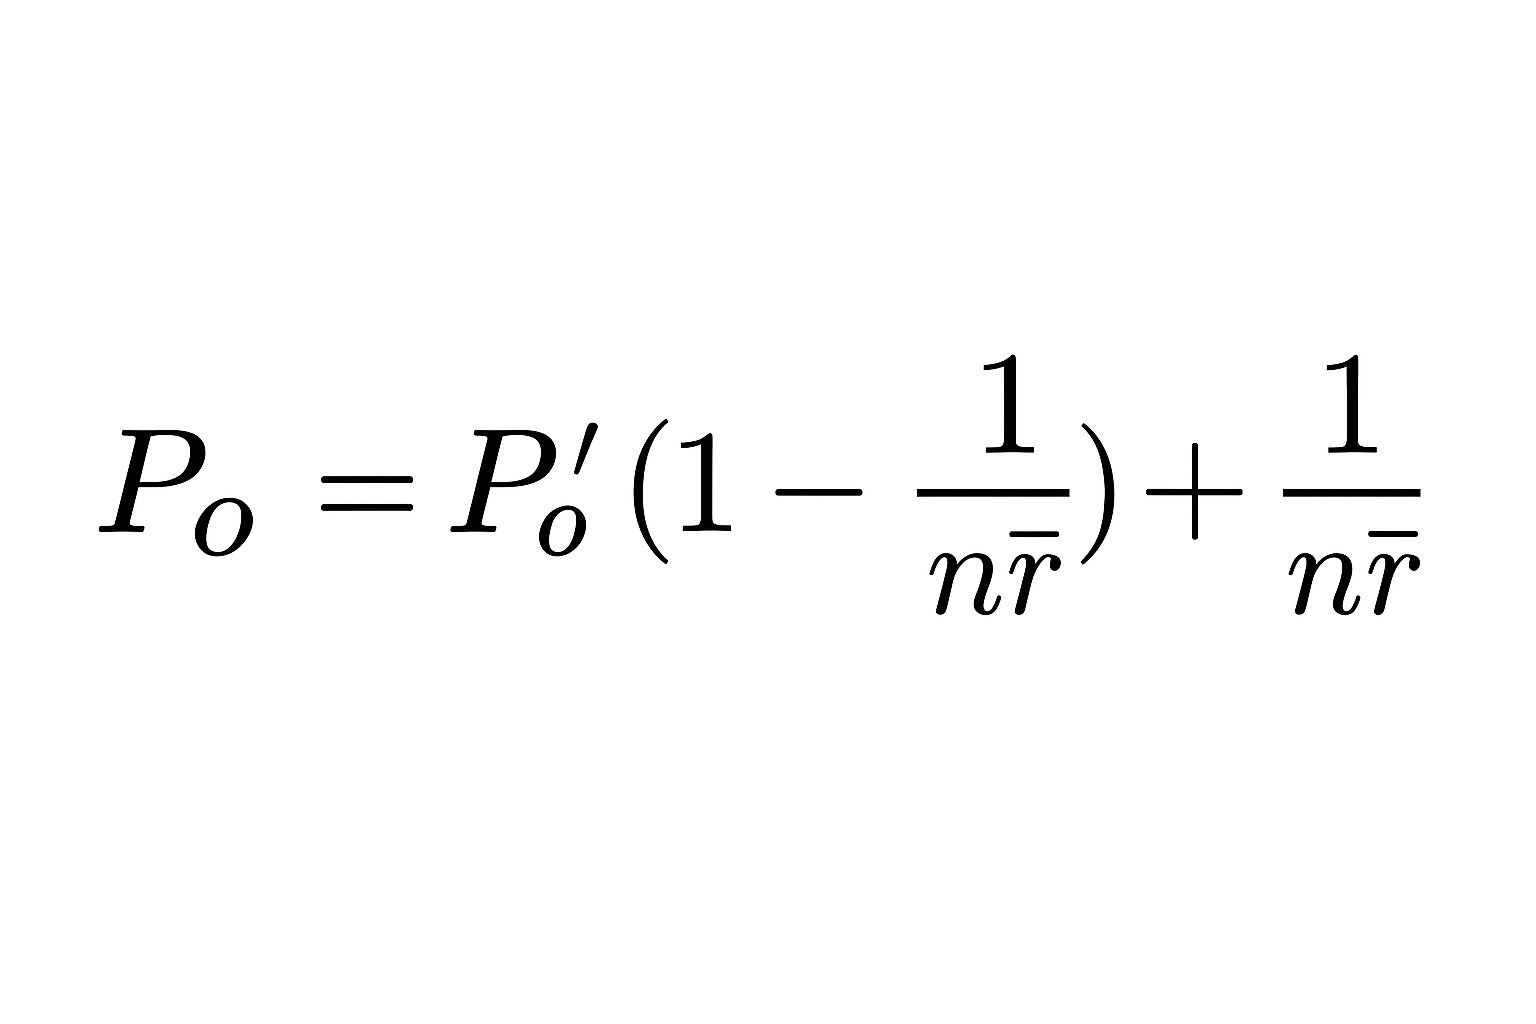
We plug in and solve: .322 ( 1 - 1/30) + 1/30 = .345
In this example, the observed agreement Po turns out to be 0.345.
Step 3: Expected Agreement (Pe)
To compute the agreement expected by chance:
- Count how often each label (1 to 5) appears across the dataset.
- Divide each by the total number of ratings (30 in this case) to get category probabilities (πk). You’ll end up with these values:
| k | 1 | 2 | 3 | 4 | 5 |
| πₖ | .2 | .17 | .27 | .27 | .1 |
- For nominal data, square each probability and sum them.
The resulting expected agreement in our case: 0.22
Step 4: Final Calculation
Now plug both values into the formula:
α = (0.345 - 0.22) / (1 - 0.22) = 0.16
How to Interpret Krippendorff’s Alpha
- 1.0 = Perfect agreement
- 0.0 = No better than chance
- < 0 = Systematic disagreement (i.e. annotators are consistently misaligned)
An alpha of 0.16 is better than chance, but not great. It likely indicates the need for better training, clearer guidelines, or a refinement of the labeling schema.
Tools for Computing Krippendorff’s Alpha
While the math can be complex, there are many tools to help:
- Python packages like krippendorff and statsmodels
- R packages like irr
- Online calculators like the K-alpha calculator
Even if you don’t compute it manually, understanding how Krippendorff’s alpha works helps you choose the right agreement metric—and take action when results are low.
Want more annotation best practices and explainers like this? Subscribe to In the Loop or check out the full HumanSignal YouTube channel.
Related Content
-

The 5 Metrics That Actually Move AI Into Production
A practical framework for turning AI metrics into clearer decisions about what to fix, ship, and scale.

Sheree Zhang
April 15, 2026
-
Scaling AI Data Quality: Best Practices for Onboarding and Evaluating Annotators
A practical workflow for onboarding and evaluating annotators with clear instructions, calibration, quality gates, reviewer feedback, and dashboards that keep labeling consistent as volume grows.

Alec Harris
March 12, 2026
-
How to Create a Prompt Generator with Label Studio and RLVR
In this article, you'll learn how to apply an RLVR-based score verifier and use an LLM as a prompt optimizer to enhance your prompts.

Label Studio Team
March 2, 2026