Label Studio Release Notes 0.8.0 - Time Series Data Labeling
Time Series Data Labeling
Time series is everywhere! Devices, sensors and events produce time series, for example, your heartbeat can be represented as a series of events measured every second, or your favorite step tracker recording a number of steps you take per minute.
All these signals can be used for ML model development, and we're excited to present you with one of the first time series data labeling solutions that work across a variety of use-cases and can help you develop ML applications based on time series data!
Labeled time series data is crucial if you want to develop supervised ML models for pattern recognition. It can also serve as a ground truth data for validating methods performance. Read below for some of the scenarios and implementation details
Labeling UI Performance
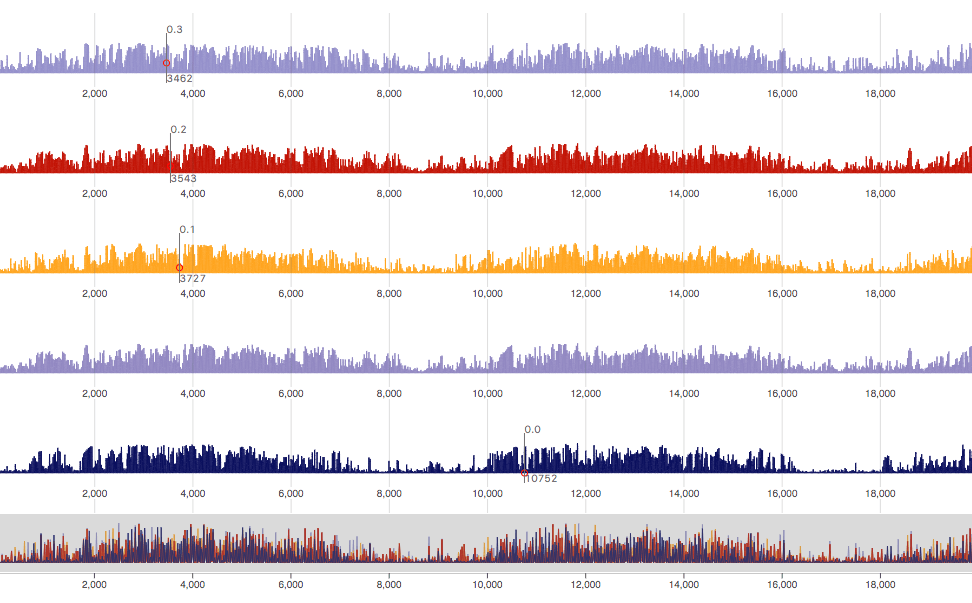
A majority of time series datasets tend to have a lot of points. Therefore the tool has to scale well to handle the situation when you have more than 100K points. Initially we've tried to use some existing frontend libraries that provide time series implementation, but it turned out that none of them were up for the task, even with just 10,000 points you'd start to experience the lag when zooming or panning. It was clear that we need to come up with a more robust implementation. We've based the rendering on d3 and after numerous optimization attempts we've got to the desired result:
1,000,000 data points and 10 channels
Some of the techniques we have used include tiling - when we have a big number of datapoint we split it into chunks and render those chunks first, this helps us achieve great performance when the number of data points is very large. When you zoom out the algorithm samples specific points to give you an overview of your time series data.
Working with a variety of input types out of the box
For examples below we will be using the following configuration:
If you're new to Label Studio, learn how you can use tags to set up different labeling interfaces for your data
Depending on where your time series data is coming from it can be formatted very differently. Label Studio provides a way to configure how time series parsing is done so you don't have to transform the original file. Let's start with a simple CSV like that:
CSV with weirdly formatted datetime, because you've captured that from a weird sensor that doesn't follow the standard:
In that case, there is timeFormat that can handle parsing for you, it uses strftime.
The valueType controls whether the input is provided as-is, or via a URL. For example, the input file may look like a list of URLs and in that case valueType="url" will load the contents of each URL and expect a time series data inside.
For the headless CSV, you can use a columns index to point to the right columns. For example, using 2 in Channel's column attribute would look for the third column (it starts from zero) inside headless CSV.
timeColumn is the name of the column with temporal data, notice that you can skip that altogether, and then it generates that for you.
You can also use timeDisplayFormat to configure the desired output of the temporal column. It can be a number or a date, if a temporal column is a date then use strftime to format it, otherwise, if it's a number then use d3 number formatting.
Zoom and Pan
Press ctrl key and use your mouse wheel to zoom and pan. If you have a huge time series, then changing the window position and size inside an overview may not let you zoom as much as you like, because it has a certain limit on its width, then you can continue zooming with a mouse wheel
Multivariate and Univariate
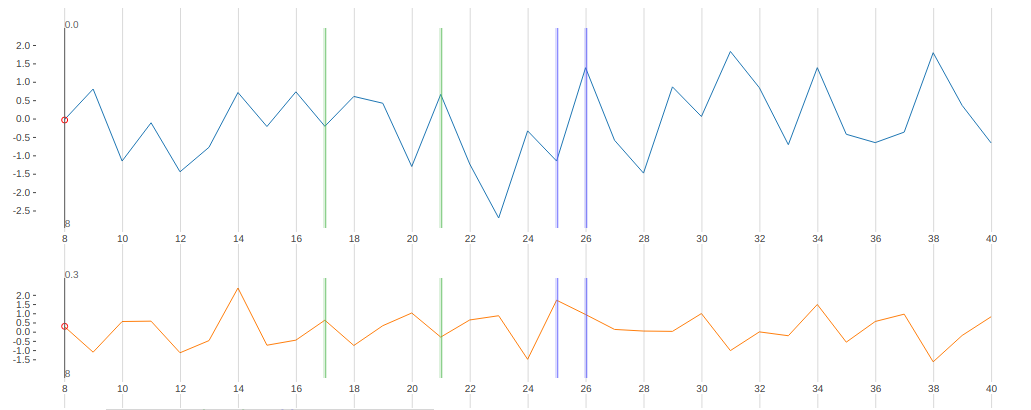
There are plenty of ways how you can setup the plots, every defined channel is synchronized with any other channel defined inside the same time series object, giving you a multivariate time series labeling experience. You can also define multiple time series objects and get distinct objects.
Use the Channel tag to represent each additional time-series channel. By providing multiple channels you get a multivariate labeling interface and can label one channel by looking at the behavior of other items at the same timestamp on another channel.
showTrackerattribute on TimeSeries object controls if you see the tracker and holdingshiftkey makes it sync between the channels
Instance labeling and snapping to the point
Double-click to put a bar labeling one particular data point, instead of labeling an entire region. And when you're creating a region it always gets snapped to the closest point.
Configuring overview
By default, an overview is created from the first channel, but you have control over that. Use overviewChannels and define what columns are included, it uses the same format as the column parameter, and can also use multiple channels inside an overview if you comma separate it.

Synchronizing across data types [experimental]
It's not always the case that you can label time series just by looking at the plots. Different events may have different representations, and in such cases, visual support is required. TimeSeries tag can synchronize to audio or video.
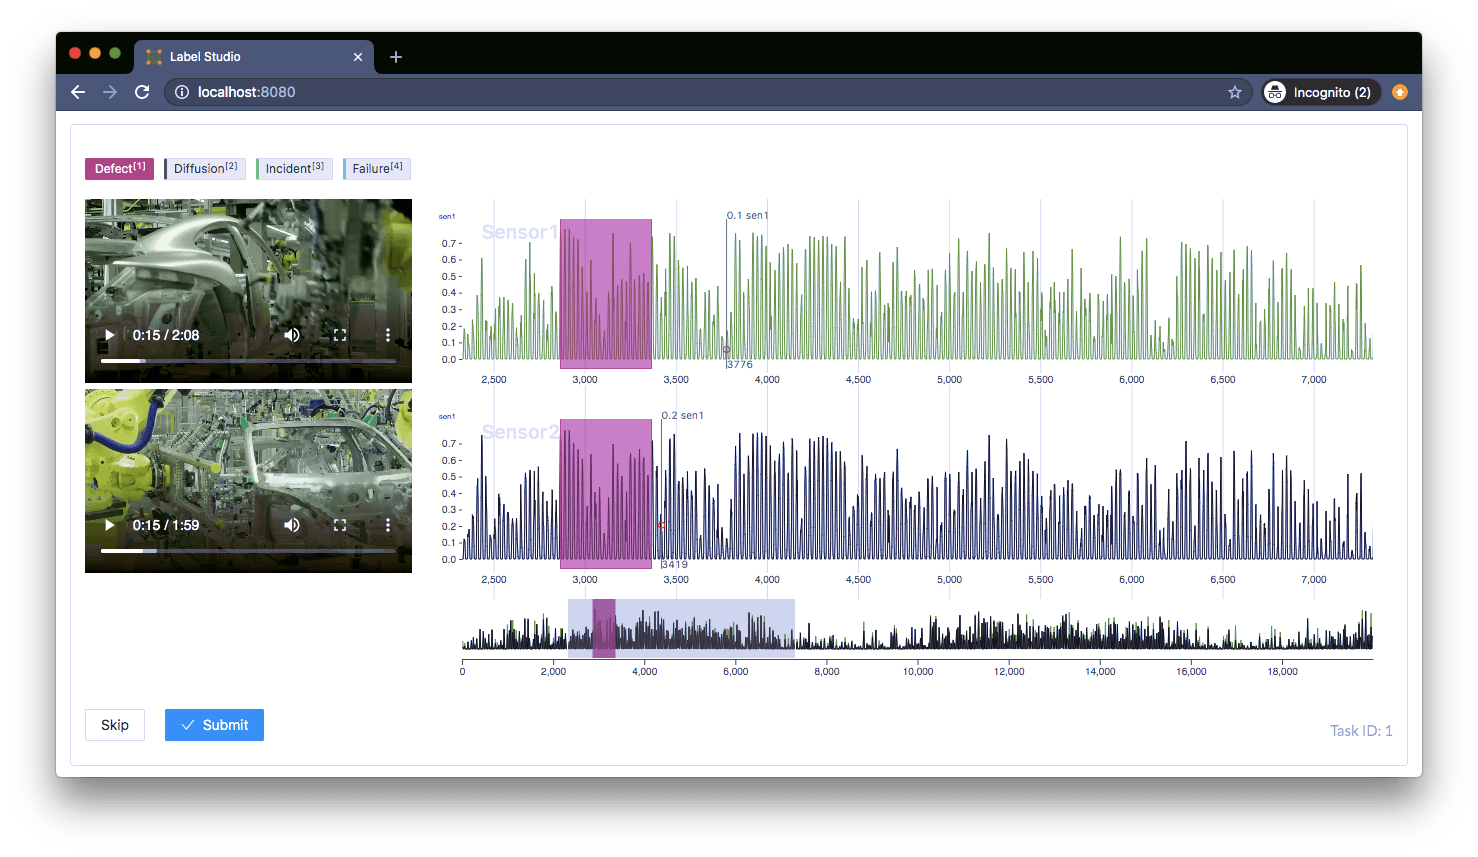
This is an experimental feature right now, and we're working on finalizing the implementation, but if you have use-cases, ping us in Slack, we will help you to set it up.
Next
Ready to try? Install Label Studio following our guide and check the template on time series configuration. Also, join the Slack channel if you need any help, have feedback, or feature requests.
Cheers!
Resources
- Label Studio
- Templates - Label Studio pre configured templates for Time Series
- TimeSeries - Time Series tag specification
- Channel - Channel tag specification
- Machine Learning
- https://github.com/awslabs/gluon-ts - Probabilistic time series modeling in Python
- https://github.com/alan-turing-institute/sktime - sktime is a Python machine learning toolbox for time series with a unified interface for multiple learning tasks.
- https://github.com/blue-yonder/tsfresh - Time Series feature extraction package
Related Content
-
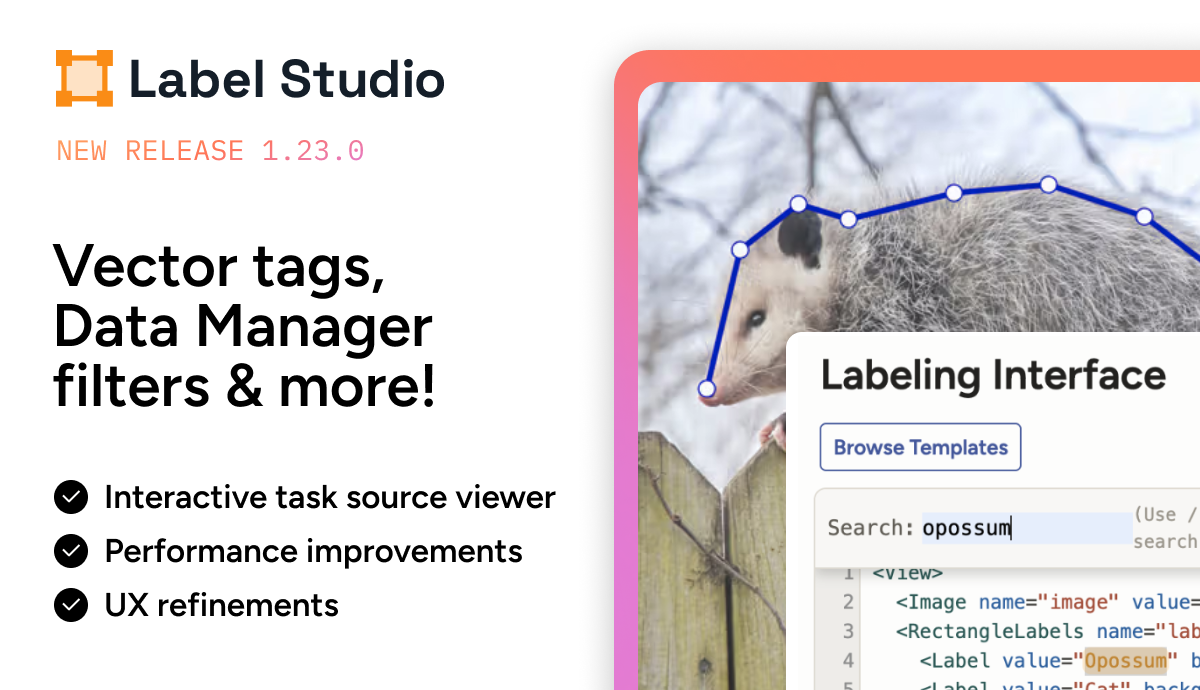
Label Studio 1.23: Vector Annotation, Interactive Task Source, and Data Manager Improvements
Vector annotation, an interactive task source viewer, and workflow improvements across the Data Manager and Template Builder.

Label Studio Team
March 13, 2026
-
Label Studio 1.21.0: Pixel Perfect Annotation, Custom Hotkeys, and Smarter Audio/Video Tools
Label Studio 1.21 delivers pixel-perfect annotation, custom hotkeys, and smarter audio/video tools to help teams work faster and with greater accuracy.
Label Studio Team
September 30, 2025
-
Label Studio 1.20.0: Spectrograms, Time Series Sync, Playground 2.0, and JSONL Support
Label Studio 1.20.0 introduces major upgrades for audio, video, and time series labeling, including spectrogram support, stream synchronization, and easier data imports.
Label Studio Team
July 1, 2025