Label Studio Release Notes 0.9.0
Above is an intro video by Nikita, one of the principal developers behind this update 👆
Explore and improve your datasets with a new Data Manager
Hi everyone, it's the beginning of January, and we're glad to have you back from the holidays! Over the last couple of weeks we’ve been finalizing a new release, and are now ready to announce it. The new 0.9.0 release is all about improving experience of working with the dataset.
Why better data management is important for Machine Learning
Labeling helps us develop better models that are capable of more accurate predictions. But the process can be very tedious. A naive way to label data is to label every sample inside the dataset. However, there are various scenarios where that’s not the optimal way to label. For example, if we already have a model, it might be sufficient to only label the examples that the model is least sure about. If the dataset is too large, it can also make sense to label only a representative sample of the dataset.
In other datasets, you want to focus on specific items in the dataset because you have extra knowledge about the feature relationships. For example, finding the words "bad" and "not recommended" can mean that sample text has a negative sentiment. Another example might be to look for and correct misinterpretations of brand names when using speech to text systems. You might want to look only at the images where a pretrained model was not able to identify any objects, so that you can create the missing bounding boxes by hand.
In each of these cases, you want to focus on specific examples of data because you already know how to process them.
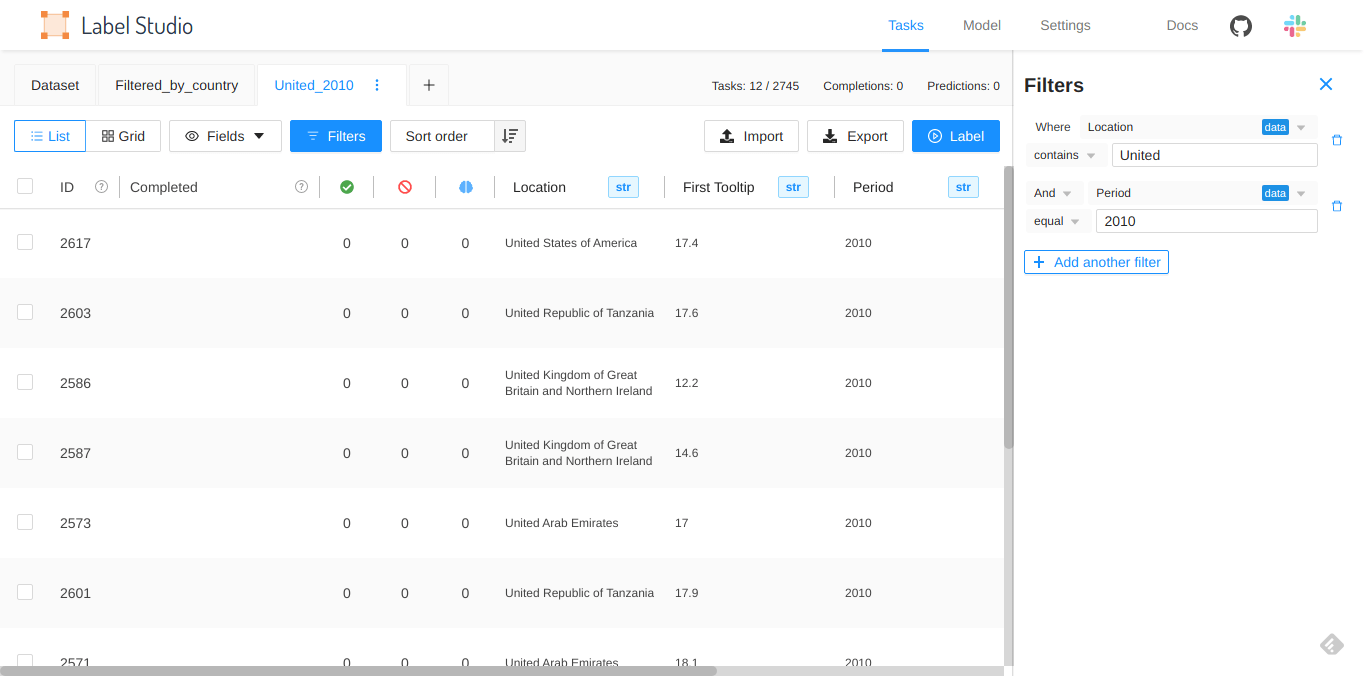
Using filters to narrow down what to label
With the new data manager, you can use filters to narrow down what to label within a dataset. You can find samples with particular features, and when those features are present they can be labeled in a certain way.
Similar to how you might set up a rule in your email client to sort a specific email into a folder, you can use logic and filters to label a data sample.
You can use filters both for the data that you’ve uploaded as well as annotation and other system data, for example, when the annotation was created.
Use filters with tabs to review and label data slices
Filters are tab-specific, so you can use tabs to view and filter specific slices of your data. For example, you can use one tab to look at all pre-labeled items from a dataset with a prediction score of less than 0.50, and use another tab to review all the items in the dataset that have not yet been labeled.
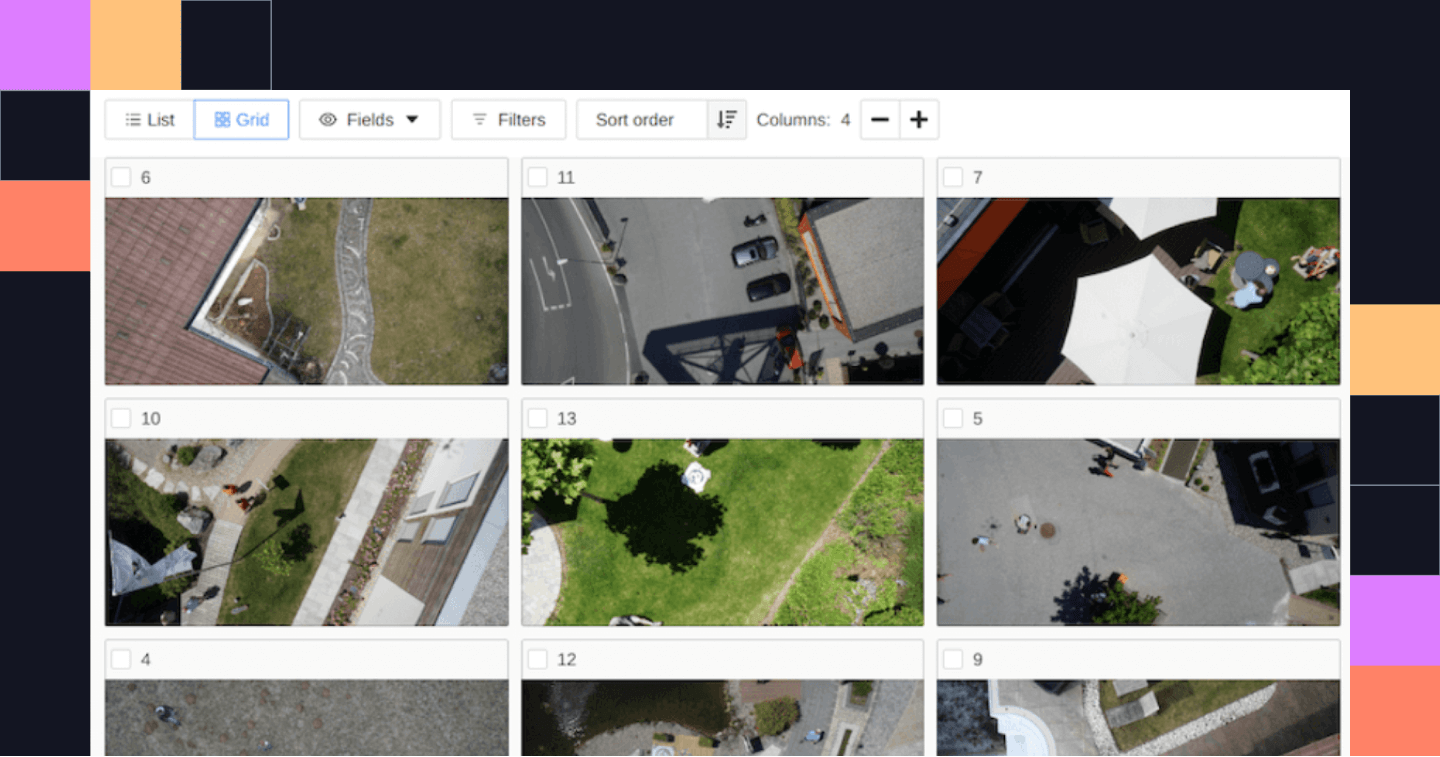
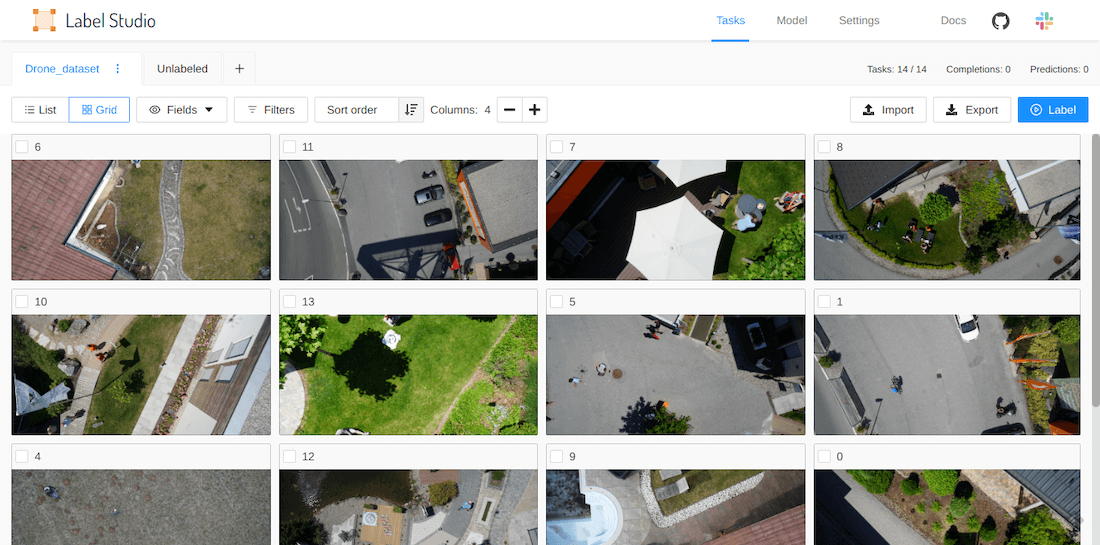
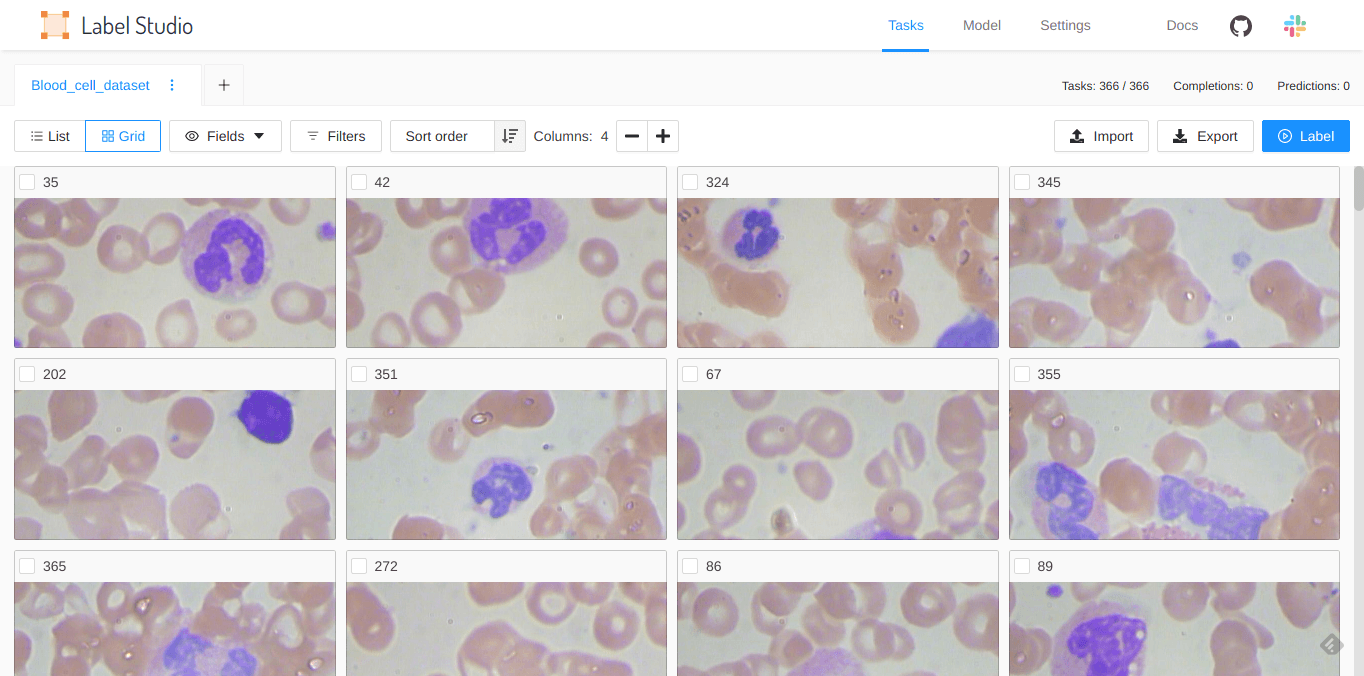
Display data in a list or a grid depending on the data type
You can view the data in the data manager in a list or a grid. If your dataset contains images or other data with a large preview, you might want to view the data in grid format. Otherwise, you can use the list view to see the fields and columns of your data, with each row corresponding to a sample of your data.
You can configure which fields appear for each row of data, which can be helpful when reviewing large CSV files.

Fields available in the data manager
Label Studio displays fields from both the data and system fields from Label Studio itself. In the list view, the fields are used as columns.
The system fields used by Label Studio are as follows:
- ID - An ID is automatically generated for each item uploaded to Label Studio. You can use this ID when using the Label Studio API.
- Completed - The date and time that the item was annotated.
- Completions - The number of annotations associated with an item.
- Cancelled - The number of times that this item was skipped during labeling.
- Predictions - The number of predictions for this item.
- Completions results - The raw JSON of the annotation results. You can use this to filter by specific labels or classes provided inside an annotation.
- Predictions score - The score returned by the model when giving its prediction. You can use this for Active Learning scenarios.
- Predictions results - The raw JSON of the prediction object.
The data fields correspond to the dataset that you upload. Example data fields that you might see are “image” for uploaded image files, or column headers from a CSV file. You can also upload metadata inside a CSV file if that metadata might be valuable for labeling the dataset. For example, you might compute the dominant color of images and upload that metadata as part of a CSV file along with the image URL. You could then filter the dataset by dominant color and label the items accordingly. Another quite common scenario is to filter out subset based on any internal database information like ID or DateTime.
Fields support different data types
Each field in the datamanager can be configured to show different types of data, right now the supported types are: string, datetime, image and audio.
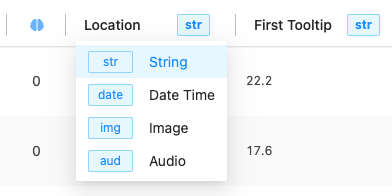
For example if you’re working with speech recognition, you can configure the field to be represented as an audio wave and have access to the audio playback right within the manager.
Use quick view to explore the dataset
When you click an item inside the data manager, a preview opens. In preview mode you can explore the different items in the dataset. This quick view is specific to the tab you’re in and only shows items from that tab.
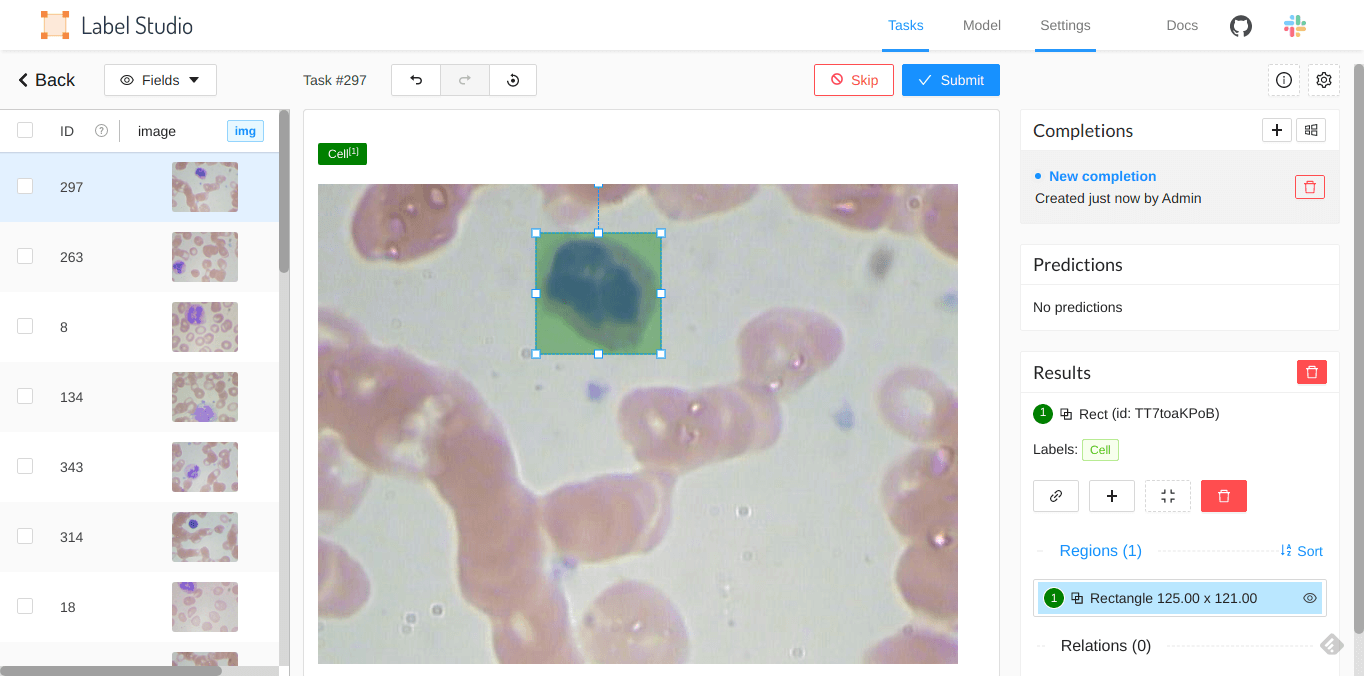
You can label the data in this preview mode, but unlike the labeling stream that you open by clicking the Label button, the preview mode doesn’t switch to the next unlabeled item after you submit an annotation.
Feedback
We made a lot of changes between the 0.8.0 and this 0.9.0 version! We’d love to hear your feedback and more about your experience using Label Studio. You can join our Slack channel or email us at hi@labelstud.io
Related Content
-
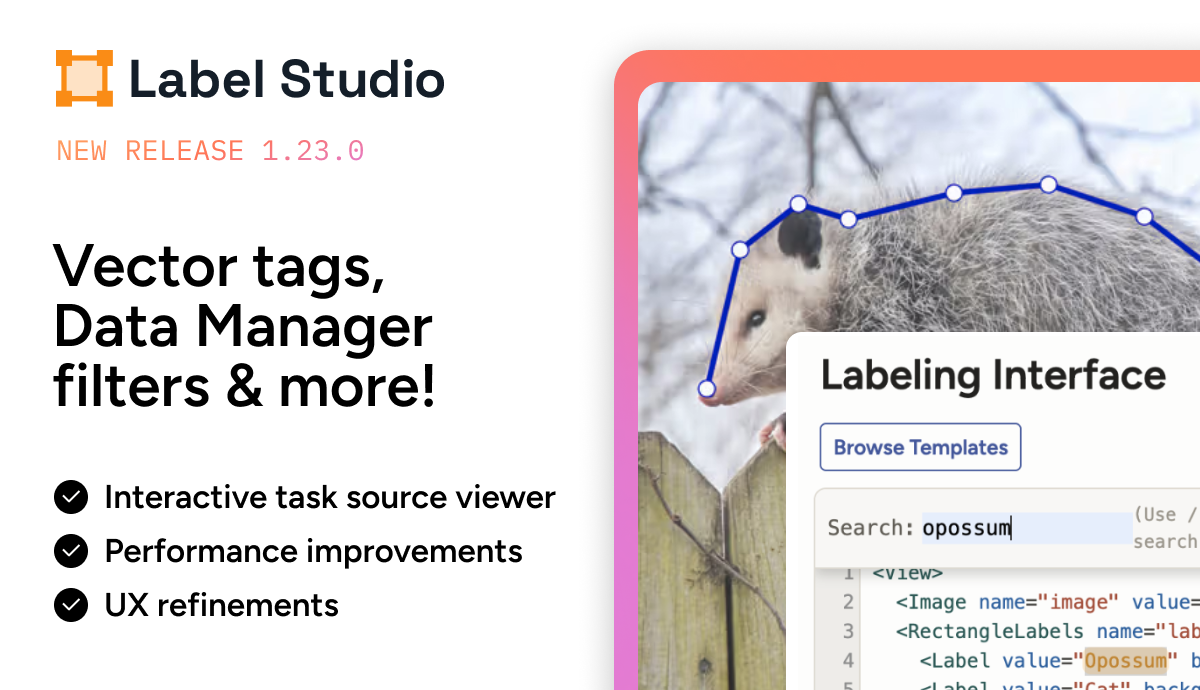
Label Studio 1.23: Vector Annotation, Interactive Task Source, and Data Manager Improvements
Vector annotation, an interactive task source viewer, and workflow improvements across the Data Manager and Template Builder.

Label Studio Team
March 13, 2026
-
Label Studio 1.21.0: Pixel Perfect Annotation, Custom Hotkeys, and Smarter Audio/Video Tools
Label Studio 1.21 delivers pixel-perfect annotation, custom hotkeys, and smarter audio/video tools to help teams work faster and with greater accuracy.
Label Studio Team
September 30, 2025
-
Label Studio 1.20.0: Spectrograms, Time Series Sync, Playground 2.0, and JSONL Support
Label Studio 1.20.0 introduces major upgrades for audio, video, and time series labeling, including spectrogram support, stream synchronization, and easier data imports.
Label Studio Team
July 1, 2025