What Is a Spectrogram? Understanding Sound Beyond the Waveform
When working with audio data, most people are familiar with waveforms, a simple graph showing the loudness of a sound over time. But for complex signals like speech or music, a waveform only tells part of the story. If you want to dig deeper into what a sound is made of, spectrograms are your next step.
Waveforms: The Starting Point
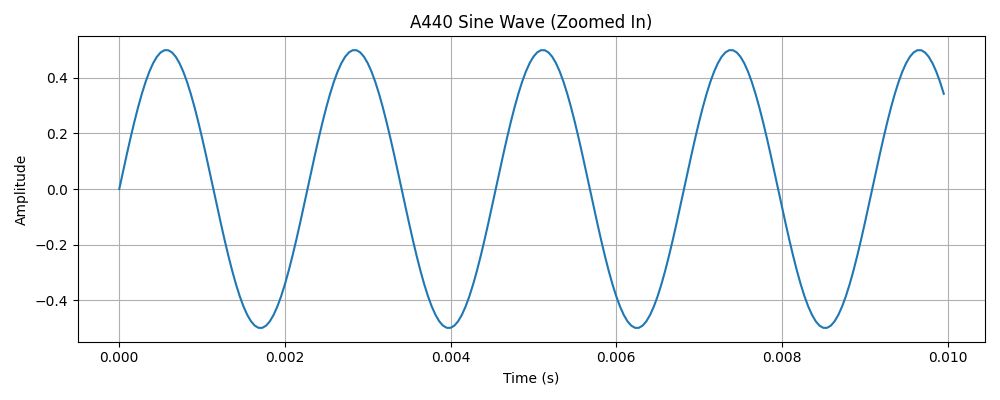
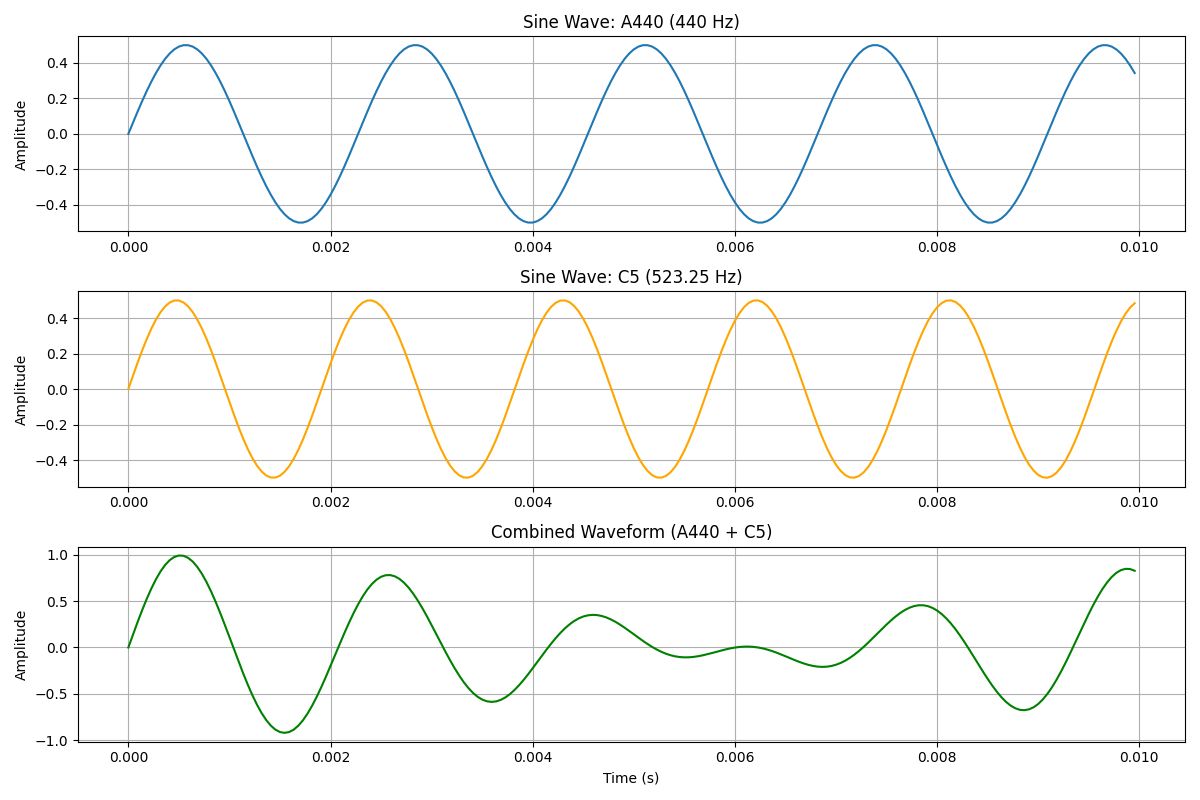
A waveform visualizes changes in amplitude (loudness) over time. It’s great for basic signals like a pure tone, say, the A440 note in music, which repeats in a clean sine wave 440 times per second.
But the moment multiple tones overlap, things get complicated. The waveform becomes the sum of those frequencies, and visually, it’s hard to untangle what's what.
What Happens When Sounds Overlap?
Let’s say you play the A440 tone (a sine wave at 440 Hz) at the same time as a C5 note (523.25 Hz). The resulting waveform isn’t two separate lines, it’s a sum of both waveforms. Sometimes the peaks line up and reinforce each other. Other times, they cancel each other out.
For example, at around 0.001 seconds, the A and C waves might both be at +0.5 amplitude, producing a combined amplitude of 1. But just a few milliseconds later, the A might be at -0.5 while the C is at +0.5, canceling each other out and flattening the wave.
This complex pattern gives us the full sound we hear, but it also hides the original ingredients. And when it comes to applications like speech recognition, audio editing, or machine learning, we often need to know exactly what those ingredients were.
Why Waveforms Alone Aren’t Enough
When we record or analyze audio, we don’t get a neatly labeled list of the frequencies that created it. Instead, we get one complex waveform, a masterpiece made of many overlapping sounds.
For some applications, that’s fine. If all we care about is when a sound starts and stops, or its loudness, the waveform might be enough.
But in fields like speech recognition,or music analysisthe structure of the sound matters. We need to know: what frequencies made up that sound? Which ones were emphasized? How did they evolve over time?
That’s where we need a tool to look beneath the surface.
The Fourier Transform: Your Frequency Decomposer
To separate out the components of a complex waveform, we use a mathematical tool called the Fourier transform.
In simple terms, it analyzes a waveform and reveals which frequencies are present and how strong they are. It turns a single, messy signal into a collection of building blocks, like separating a chord into individual notes.
We won’t get into the math here, but if you’re curious, we highly recommend 3Blue1Brown’s visual explanation of the Fourier transform. It’s one of the most intuitive introductions out there.
What Is a Spectrogram (and How Do You Make One)?
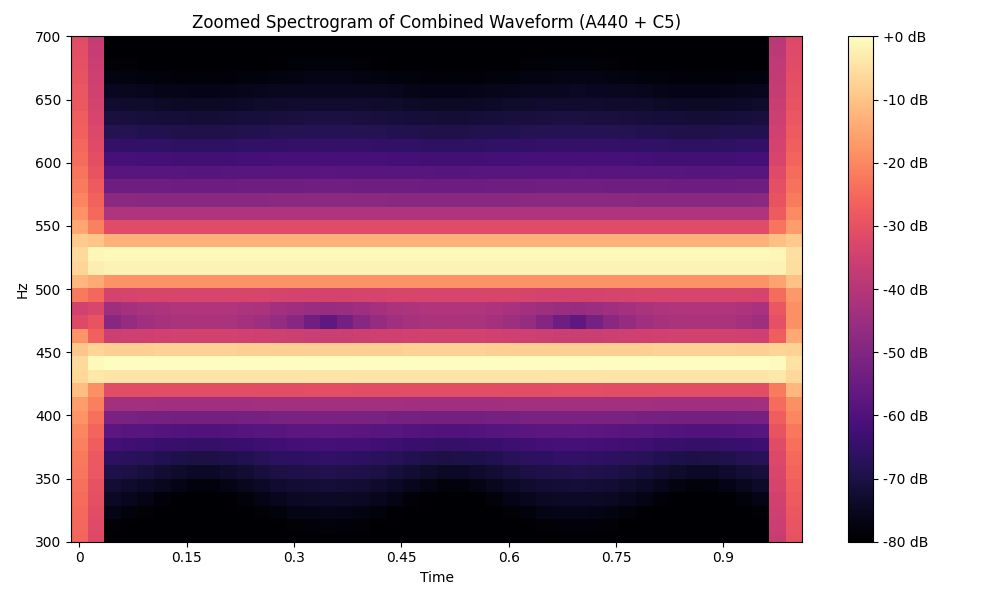
A spectrogram uses the Fourier transform to show how a sound’s frequency content changes over time.
Here’s how it works:
- First, slice the waveform into small time windows.
- Next, run a Fourier transform on each window to get its frequency breakdown.
- Finally, stack those windows in sequence to form a time-frequency graph.
The result is a two-dimensional plot:
- X-axis = time
- Y-axis = frequency
- Color/brightness = amplitude (how strong that frequency is at that time)
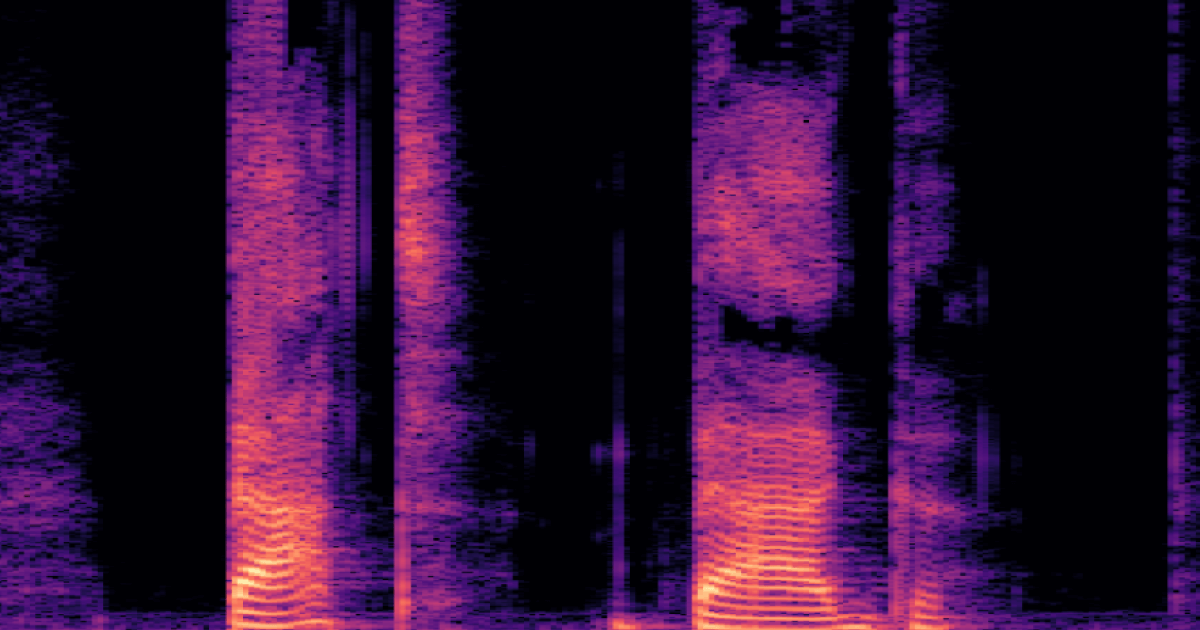
Let’s go back to the A440 + C5 example. The raw waveform showed a complex mix. But once we generate a spectrogram, we clearly see two distinct frequency bands, one at 440 Hz and one at 523 Hz. That’s the power of this tool: it reveals structure hidden inside the sound.
Why Spectrograms Matter in Speech Recognition
Nowhere is this more useful than in speech analysis. Human speech is made of rich, overlapping frequencies shaped by our vocal tract. These resonant frequencies, called formants, carry vital information about what sound was produced.
Take the words “bat” and “bag.” While the waveform may look similar early on, a spectrogram reveals key differences in the final sounds. The voiced “g” in “bag” produces what linguists call a velar pinch, a visible pattern where formants F1 and F2 converge. The voiceless “t” in “bat,” on the other hand, ends in a sharp cutoff.
Phoneticists often focus on:
- F0: whether the sound is voiced (like “b”) or voiceless (like “p”). In other words, whether the vocal folds are vibrating or not.
F1 and F2: which indicate the actual vowel or consonant based on their distance and motion
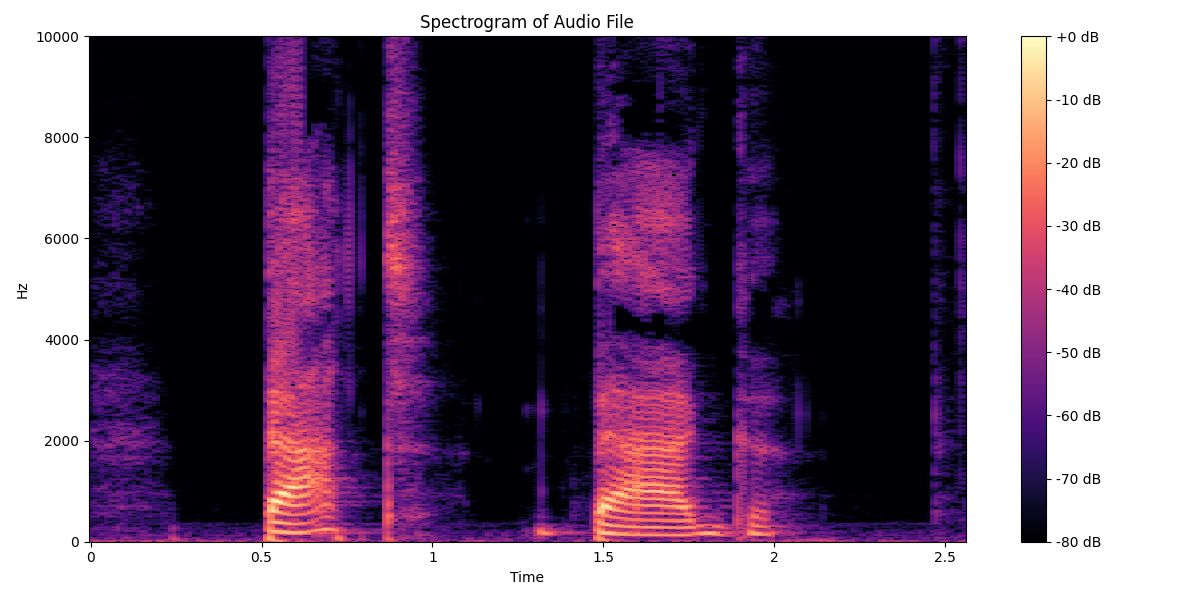
In “bat,” the first word in this spectrogram, F0 cuts out sharply and F1 and F2 stay evenly spaced apart. In “bag,” the second word, F1 and F2 open and pinch back together at the end.. These differences are subtle in audio, but obvious in a spectrogram and critical for accurate transcription or language modeling.
Beyond Speech: More Use Cases
Spectrograms aren’t just for linguists or ASR (automatic speech recognition) researchers. You’ll find them in:
- Music production, to isolate and analyze notes or instruments
- Environmental sound classification, like identifying animal calls or engine failures
- Medical diagnostics, such as interpreting heartbeats or breath patterns
- Machine learning pipelines, especially for training models on structured audio input
If you’re working with sound data, spectrograms help you understand how that sound was produced, not just when.
Watch the full in the loop video here:
Related Content
-

The 5 Metrics That Actually Move AI Into Production
A practical framework for turning AI metrics into clearer decisions about what to fix, ship, and scale.

Sheree Zhang
April 15, 2026
-
Scaling AI Data Quality: Best Practices for Onboarding and Evaluating Annotators
A practical workflow for onboarding and evaluating annotators with clear instructions, calibration, quality gates, reviewer feedback, and dashboards that keep labeling consistent as volume grows.

Alec Harris
March 12, 2026
-
How to Create a Prompt Generator with Label Studio and RLVR
In this article, you'll learn how to apply an RLVR-based score verifier and use an LLM as a prompt optimizer to enhance your prompts.

Label Studio Team
March 2, 2026