How to Label Multichannel Time Series Data for AI Models
Label Studio now supports multichannel time series data. That means you can visualize and annotate complex sensor or signal data across multiple channels, all within the Label Studio interface. But what does that mean in practice, and how can you use it? Let’s take a closer look.
Why Multichannel Time Series?
Time series data is everywhere—from wearable devices tracking biometrics, to industrial sensors monitoring machinery, to financial systems analyzing trends. Often, the real power of this data comes not from a single stream, but from the relationships between channels: multiple sensor streams recorded over the same time axis.
Until now, Label Studio could handle time series-like data using basic line charts or audio visualizations, but there wasn’t a flexible, scalable way to label synchronized, multichannel time series. That’s changed.
Use Cases for Multichannel Time Series Annotation
Here are a few real-world domains where this feature can supercharge your AI data pipelines:
- Wearable Sensor Analytics: Annotate multichannel health signals (like ECG, EMG, respiration, etc.) for activity recognition, sleep staging, or stress detection.
- Predictive Maintenance: Label multichannel vibration or temperature readings from industrial machines to detect anomalies and predict faults.
- Human-Computer Interaction: Analyze synchronized streams of motion sensors, eye tracking, or pressure pads to train interaction models.
- Financial Analytics: Annotate synchronized multivariate market indicators (e.g. volume, price, volatility) for anomaly detection or event prediction.
- Environmental Monitoring: Label climate or pollution data from sensor arrays for pattern analysis or event detection.
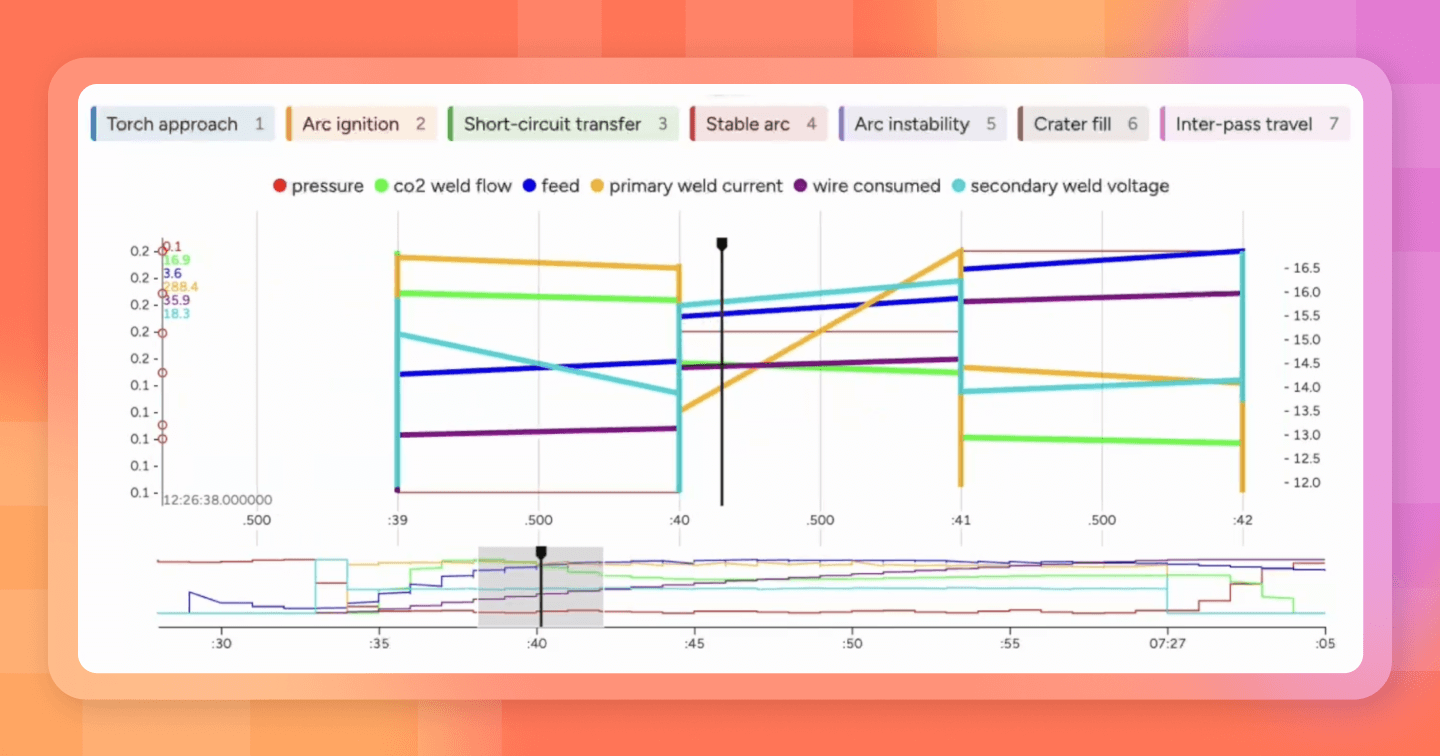
How Multichannel Time Series Looks in Label Studio
In Label Studio, each time series channel appears as its own row on a shared time axis—synchronized and scrollable. You can visualize, zoom, and label directly on the plot. The interface supports:
- Multiple line charts stacked by channel
- Global time alignment for cross-channel context
- Region selection across time (with or without labeling across all channels)
- Zoom and pan tools
- Configurable colors and labels per channel
How to Set Up Multichannel Time Series in Label Studio
Ready to get started? Follow these steps to configure your labeling project:
1. Prepare Your Data:
Format your time series data as a JSON array or CSV-like structure with multiple numeric arrays indexed by timestamp.
{
  "data": {
    "signals": {
      "channel_1": [...],
      "channel_2": [...],
      "channel_3": [...]
    },
    "timestamps": [...]
  }
}2. Define Your Labeling Interface
Use the <TimeSeries> tag in your labeling config. Here’s a basic template:
<View>
  <TimeSeries
    name="ts"
    value="$timeseries"
    valuetype="url"
    timeColumn="time"
    timeFormat="%Y-%m-%d %H:%M:%S.%f"
  >
    <MultiChannel>
      <Channel column="velocity" />
      <Channel column="acceleration" />
    </MultiChannel>
  </TimeSeries>

  <TimeSeriesLabels name="label" toName="ts">
    <Label value="Run" background="red"/>
    <Label value="Walk" background="green"/>
  </TimeSeriesLabels>
</View>

<!-- {
  "timeseries": "https://app.heartex.ai/samples/time-series.csv?time=time&values=velocity%2Cacceleration&tf=%25Y-%25m-%25d+%25H%3A%25M%3A%25S.%25f&type=csv"
} -->3. Upload Tasks
Use the Label Studio UI or API to import your tasks with the multichannel time series structure.
4. Customize and Annotate
- Click the gear icon below the chart to adjust channel visibility, zoom levels, and color schemes.
- Select regions across time to apply labels.
- Annotate one or more channels in synchrony.
Tips for High-Quality Annotations
- Use consistent sampling rates across channels.
- Normalize or standardize data if amplitude differences are misleading.
- If labeling events spanning multiple channels, consider using global region labels.
- Keep label instructions clear—e.g. "Mark the start of signal degradation" or "Tag all anomalies in Channel 2".
Related Content
-
Building A Labeling Config in Label Studio Enterprise
How do you build the right labeling interface in Label Studio? This video walks through a practical progression: start with templates, customize with XML tags, extend with React Code, and standardize workflows with plugins.
-
Learn how to connect YOLO26 to a Label Studio project using the YOLO ML Backend so annotators can start from model predictions and focus on review and correction instead of drawing boxes from scratch.

Micaela Kaplan
February 12, 2026
-
Getting started with Label Studio
Everything you need to know about Label Studio to get started, from downloading and installing the tool to creating your first project, adding new members, and more!