Getting Started With Label Studio: A Step-By-Step Guide
Labeling Your Data
After setting the project up, you’ll be presented with the Label Studio project data page. This page looks overwhelming at first glance, so we’ll break it down into easy-to-digest parts.
Reviewing your imported data
Looking at the top of your screen, the top menu bar will have more detail about each of the columns in Label Studio.
Examine the data that was imported. You’ll have a name and associated data type for each column in your CSV file. This enriched data set doesn’t just include the reviews (found in the “review” column) but also information about the number of stars that the review had, a link to the movie page on IMDB, and several IDs (one assigned by Label Studio, one assigned during the data preparation, and a non-unique one from the original data set). For now, you can ignore these fields, and focus on the “review” column. This data is what annotators will evaluate and assign a sentiment of either “Positive” or “Negative.”
Using Label Studio’s terminology, each row corresponds to a labeling “task.”
Review Label Studio’s Additional Metadata
The first four columns in this view contain label metadata used by Label Studio to measure the progress and effectiveness of the labeling team. These include the data ID, the date labeling was completed, the number of annotations per task (to improve labeling accuracy, you can have multiple labels on each task), the number of times an annotator has skipped a task, the total number of predictions (including from pre-labeled sets or ML labeled tasks), and who has labeled the data in the task.
This top row of information is adjustable, allowing you to customize the view that you see by clicking and dragging the menu bar items (much like in Excel or Google Sheets).
Time to Label some Data!
Now that we’ve got our data imported, and the interface set up, we can start labeling!
Click on the bright blue `Label All Tasks` button at the center of the toolbar to enter the labeling interface. You’ll then be presented with a screen with the label interface you defined during setup. You’ll notice that the text is drawn from the data set we imported. There will be a directive to choose from the sentiment options. To the right of the screen, there are additional buttons to “Skip” or “Submit” an annotation.
Using your judgment, you can select the sentiment of the text and choose “Submit” to move on to the next labeling task. Within this particular interface, you can speed up your annotations with the keyboard shortcuts listed next to the annotation options, in this case ‘1’ for ‘Positive’ and ‘2’ for ‘Negative.’ If you’re unsure of the sentiment to apply to the text, just select “Skip” to move to the next task.
Without further ado — label away!
Exporting your data
Fast forward in time and you’ve now completed the 100 pieces of data in the sample dataset. You can return to the data page by selecting the project title from the interface toolbar. With the labeling job completed, you can export this data to use in the rest of your machine learning or data science pipeline.
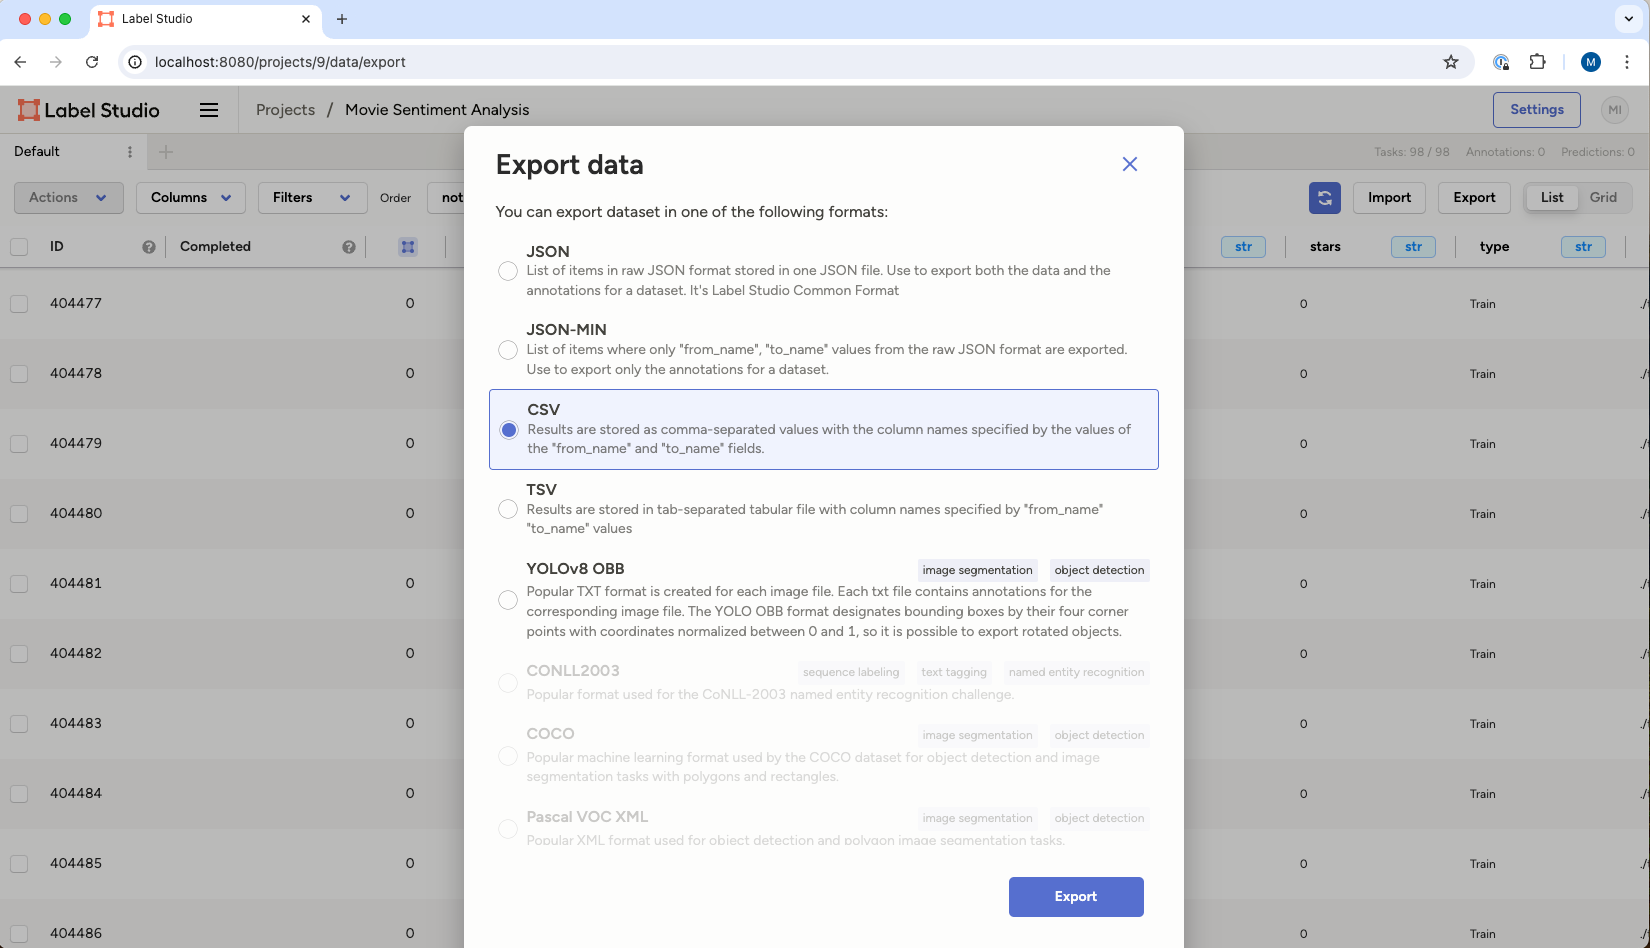
Label Studio supports various formats. For text-based data akin to what we worked with today, the options include JSON, JSON-MIN, CSV, or TSV. If we were working with a dataset that included images, object detection, or numerical data, our export options would slightly differ. For non-tabular data you will typically export a JSON file of the labels that includes references to the original images, video, or sound files you had your team label.
To keep things simple, you’ll export your labeled data as a CSV file.
In the interface, select the “Export” button. Then select “CSV” as the export format. Select the “Export” button at the bottom of the dialogue, and you will be prompted to save the exported data to your local disc.
Using exported data
Exported data can be used in a multitude of ways — to speed up a classification in further data analysis, provide more accurate feedback to train a model, or even to make cumbersome tasks like search or trend prediction easier. Integrations with cloud data storage options and other DevOps tools and processes through our API allow further flexibility in use cases and annotations.