Getting Started With Label Studio: A Step-By-Step Guide
Setting up Label Studio
Installing Label Studio
You can get up and running with Label Studio in many ways (check out our docs on how to install it via pip, Ubuntu, Anaconda, or directly from the source). In the next few steps, we’ll install Label Studio via Docker.
Begin by installing Docker. The Docker community has great installation instructions for almost every common platform, and their desktop version can get you up and running fast.
Once you’ve got Docker set up, let’s dive into how to install Label Studio on Docker.
Open up your terminal and run the following command:
# Run latest Docker version
docker run -it -p 8080:8080 -v `pwd`/mydata:/label-studio/data heartexlabs/label-studio:latestThis will download the latest open source release of Label Studio, launch it inside of a Docker container, and make the interface available through a web browser on your local machine. After Docker has loaded the application, you can navigate to http://localhost:8080, where you’ll be greeted with the login screen for Label Studio.
You’ll need to create a new user account, then log in with that information. As long as Docker is running the Label Studio application, you can return to the interface at any time and resume where you left off using your login credentials.
Creating your Project
The first time you log in to Label Studio, you’ll be presented with the Projects Page, which is the home base for all your data labeling projects. You’ll be able to create new projects, edit or revisit existing projects or even invite teammates. This will become your default view, presenting you with all the projects you have access to.
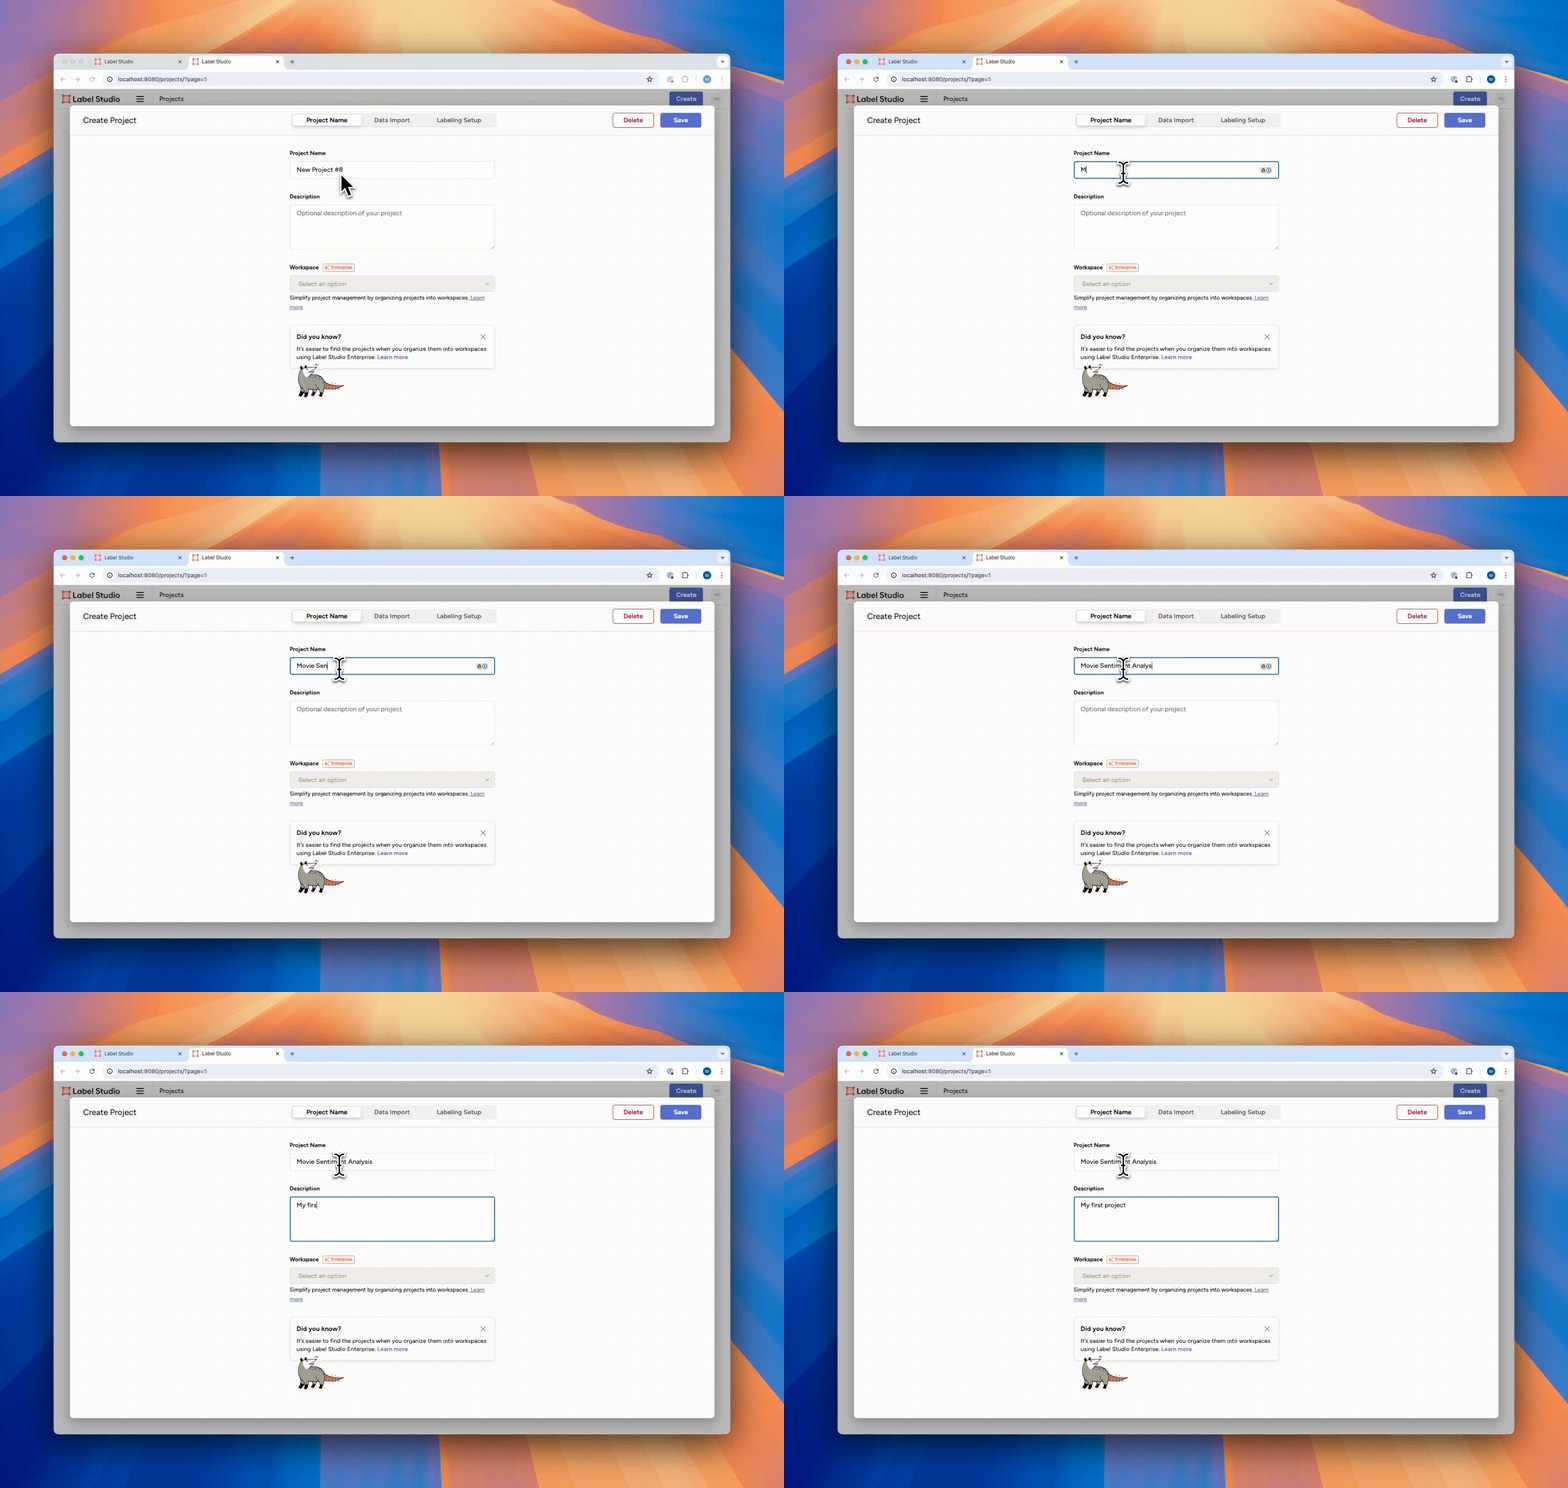
Click on the blue button in the upper right-hand corner of your screen to create a new project.
The project creation panel will present you with three tabs. In the first tab, “Project Name,” you can name and describe the project. In this case, we can call it “Movie Sentiment Analysis,” with the description “My first labeling project.”

Importing your data
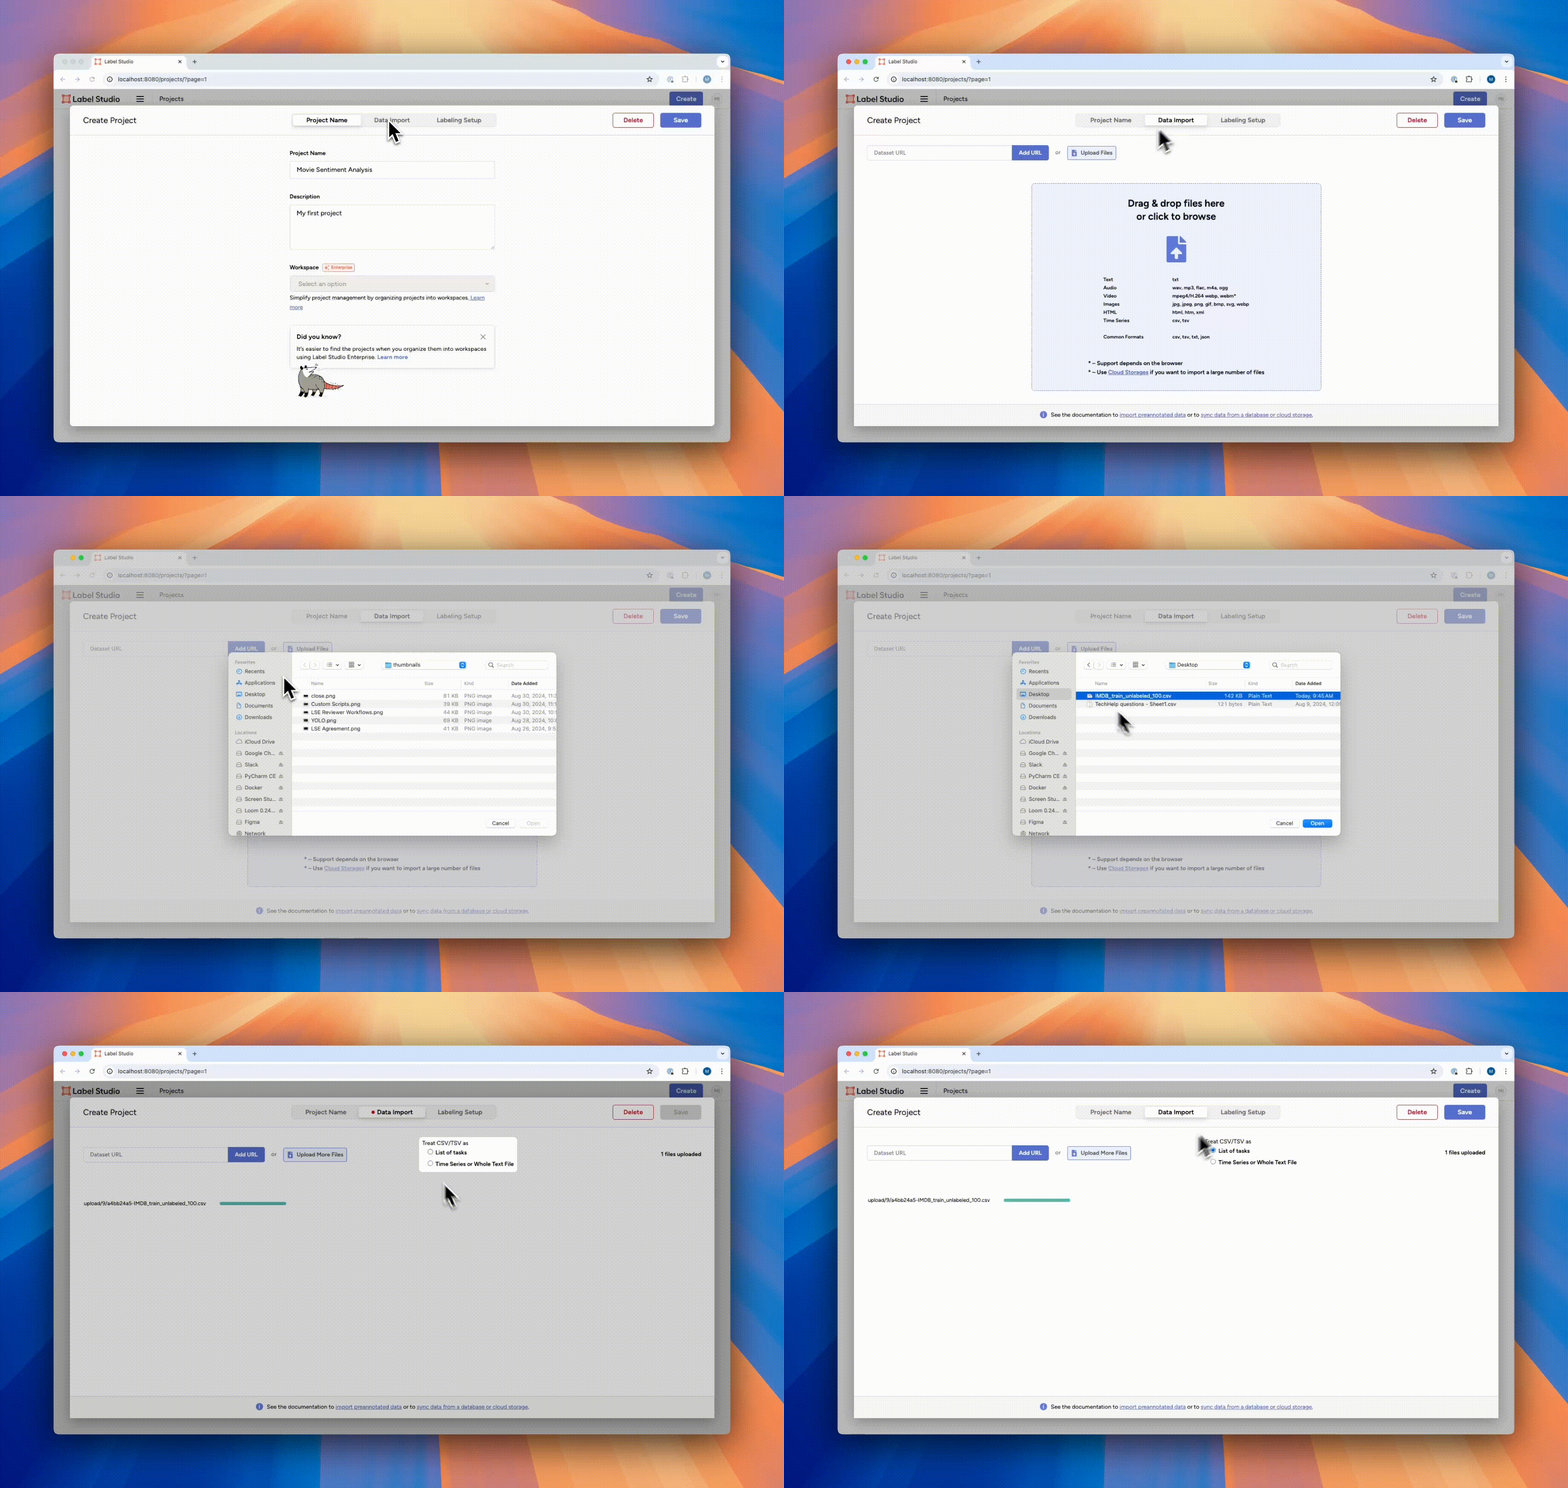
The next tab, “Data Import,” will present you with an interface to load a data set. Label Studio offers two options for loading data. You can upload data directly to the application, or connect Label Studio to your cloud storage. Cloud storage has many advantages, including automatic updating and additional data security. For this tutorial, we will use the direct upload option.
- Download this csv file.
- Select the “Upload Files” button, and follow the dialogue to upload the `IMDB_train_unlabeled_100.csv` file you just downloaded.
- When prompted, choose “Treat CSV/TSV as List of tasks” to import each line of the data file as a unique data item for labeling.

A future tutorial will revisit the data import dialogue, where you will add additional pre-annotated data to this initial modest data set to learn more about machine learning integrations.
Setting up the Labeling Interface
In the next tab, titled “Labeling Setup,” you’ll prepare the labeling interface. This labeling interface is the UI that the annotator will see when they go to label the data. The big question in building out a UI is how do you translate the schema that you’ve written into functional code? The first thing you’ll want to think about is what kind of question you’re asking. Is it multiple choice? Open ended? Rating or ranking? You’ll also want to think about how you can build a UI to be as easy as possible for your annotators. Is there a logical sequence to the questions that you’re asking? Where do you want to specify what your annotators can choose from, and where do you want to give them more freedom in their answers?
From a UI perspective, you’ll also want to consider what data or metadata you show to your annotators so that they can be successful. You can display whatever information you’d like in the labeling UI, but try to only show annotators the information that is crucial for their success so that the interface doesn’t get cluttered and difficult to understand.
Label Studio provides a library of templates to get up and running in the Labeling Interface, with no coding or hours spent customizing it required. These include computer vision, audio/speech processing, conversational AI, NLP, Generative AI, and many more — there are plenty of templates for you to get started with.
Thanks to the use of XML-like tags, similar to writing HTML and CSS, you can customize the Labeling Interface to fulfill your needs better. In addition to these customizations, many data labeling teams choose to add on additional instructions to guide labelers or give them more context about the data set.
Preparing the labeling interface for sentiment analysis
When setting up the labeling interface for our tutorial, we’ll set it up for an NLP-type of data annotation, sentiment analysis.
Select “Natural Language Processing” from the left side of the dialog, then select the “Text Classification” template. You’ll be presented with a split-pane view to help you configure your labeling interface. On the left is an automatically generated visual editor that allows you to choose which columns of the data you want to label and create a set of labels that you can assign to each data point. If you need more control over your labeling interface, you can switch to a code editor that allows you to edit the XML template directly.
On the right side of the split pane is a UI preview of the labeling interface, which allows you to evaluate exactly what interface your labelers will be working with.
You will need to adjust the interface to do two things. The first is to create the appropriate labels for this project.
Sentiment analysis usually tends to have a range in intensity of an emotion or feeling that someone might be conveying. For example, stubbing your toe, on average, creates less discomfort than breaking your arm. In this case, we’re labeling whether the viewer either liked the movie or didn’t. Suppose you were looking to gain more information from your data and train a model across a wider range of sentiments. In that case, you could add additional options such as: “informational,” “sad,” “angry,” “happy,” or “not interested.”
Since the original dataset already includes labels with only two sentiments, “Positive” and “Negative,” you will want to follow the convention set by the data set authors. The chosen template contains three sentiments, “Positive,” “Negative,” and “Neutral.” Delete the “Neutral” sentiment by clicking on the red ‘x’ next to it in the visual editor.
The next item you will need to adjust is the data presented in the interface to label. Recall that the data set has several columns, many of which are metadata associated with the data set. You will want to set the interface to show the “review” field of the data to the labeler. Do this by selecting “$review” from the “Use data from field” option under the “configure data” header in the visual editor.
Confirm that the interface is configured the way you want it, then click “Save” in the upper-right-hand corner of the dialog. Your data has been imported, and your labeling interface is ready to use!
Overall, what options you have in your interface largely depends on your project requirements. Your business application, model, and data types will be major factors in determining how the interface will be set up for your data annotators.
Now that you’re all set up, let’s dive into the labeling process!