Labeling guide
Label and annotate your data with the open source data labeling tool, Label Studio. After you set up your project and labeling interface and import your data, you can start labeling and annotating your data.
- Open a project in Label Studio and optionally filter or sort the data.
- Click Label All Tasks to start labeling.
- Use keyboard shortcuts or your mouse to label the data and submit your annotations.
- Follow the project instructions for labeling and deciding whether to skip tasks.
- Click the project name to return to the data manager.
You can also collaborate with other annotators to improve the quality of your labeled data.
Start labeling
Some labeling tasks can be complicated to perform, for example, labeling that includes text, image, and audio data objects as part of one dataset and labeling task, or creating relations between annotations on a labeling task. This section includes guidance on how to perform more complex labeling tasks, such as labeling with relations, overlapping regions, selected tasks, or changing labels.
Choose which tasks to label
From a project, click Label All Tasks to start labeling all tasks. To label the tasks as they are filtered and sorted in the data manager, select Label Tasks As Displayed instead.
You can also label a specific task in the Quick View or Preview by clicking it from the project data manager view, but you won’t automatically see the next task in the labeling queue after submitting your annotations.
You can also select the checkboxes next to specific tasks and then click Label $n Tasks to label the selected number of tasks. For example, select the checkboxes for 5 different tasks, then click Label 5 Tasks to label only those 5 tasks.
note
When labeling tasks, you should not open the label stream (meaning to click Label All Tasks) simultaneously in two tabs. This could result in you receiving the same task twice, which can circumvent project settings that address annotator overlap.
Label a region in the data
Annotate a section of the data by adding a region.
- Select the label you want to apply to the region. For some configurations, you can skip this step.
- Click the text, image, audio, or other data object to apply the label to the region. Your changes save automatically.
- Click Submit to submit the completed annotation and move on to the next task.
Label overlapping regions
When you label with bounding boxes and other image segmentation tasks, or when you’re highlighting text for NLP and NER labeling, you might want to label overlapping regions. To do this easily, hide labeled regions after you annotate them.
- Select the label that you want to apply to the region.
- Draw the bounding box or highlight the text that you want to label.
- In the Regions or Labels sidebar, locate and select the region that you labeled and click the eye icon to hide the region.
- Or press cmd or ctrl to draw over the existing Regions or Labels (NOTE: This do not work for Keypoints)
- Select the next label that you want to apply to the overlapping region.
- Draw the bounding box or highlight the text that you want to label.
- Continue hiding and labeling regions until you’ve completed annotating the task. If you want, select the eye icon next to Regions to hide and then show all regions labeled on the task to confirm the end result.
- Click Submit to submit the completed annotation and move on to the next task.
Select multiple regions
You can select multiple regions while labeling to make changes to them together.
- After creating multiple regions, press
ctrland click each region that you want to select. You can select regions on the object that you’re labeling or in the Regions sidebar. Select a range of regions in the Regions sidebar by clicking the first region in the list that you want to select and holdingShiftwhile you click the last region in the list that you want to select. - After selecting the regions you can apply a label to all selected regions or delete them.
- Click a selected region or press
uto deselect it.
Duplicate regions
You can duplicate a region to create many identically-sized polygons, rectangles, or ellipses.
- Select the region that you want to duplicate.
- Press
ctrl + dto duplicate the region, or the sequence ofctrl + candctrl + vto copy and paste the region. Duplicated regions appear in the exact location as the region being duplicated. If you’re using a Mac keyboard, usecmdinstead ofctrl. - Click the arrow tool, then move and resize the newly-created region.
Change the label
You can change the label of an existing region.
- Select the labeled region, for example a span, bounding box, image segment, audio region, or other region, on the object or using the Regions sidebar.
- Select a new label. Your changes to the label save automatically.
- Click Submit to submit the completed annotation and move on to the next task.
Delete a labeled region
You can delete labeled regions, such as bounding boxes or text spans, if needed.
- Select the labeled region on the object or in the Regions sidebar.
- Press the Backspace key, or go to the Results panel and remove the selected annotation.
Delete an annotation
After labeling a task, you can delete the annotation by clicking the trash can button to delete an annotation on the task. If you haven’t saved your annotation yet, click the X icon to reset the task and remove your labeling activity.
You can also delete all annotations on a task from the project page. See Delete tasks or annotations.
Add relations between annotations
You can create relations between two results with both directions and labels. To add labels to directions, you must set up a labeling config with the relations tag. See more about relations with labels in the Tags documentation.
- Select the region for the annotation that you want to relate to another annotation. If you’re creating a direction-based relation, select the first one first.
- In the Regions section of the Results sidebar, click the Create Relation button that looks like a hyperlink icon.
- Select the second region for the annotation to complete the relation.
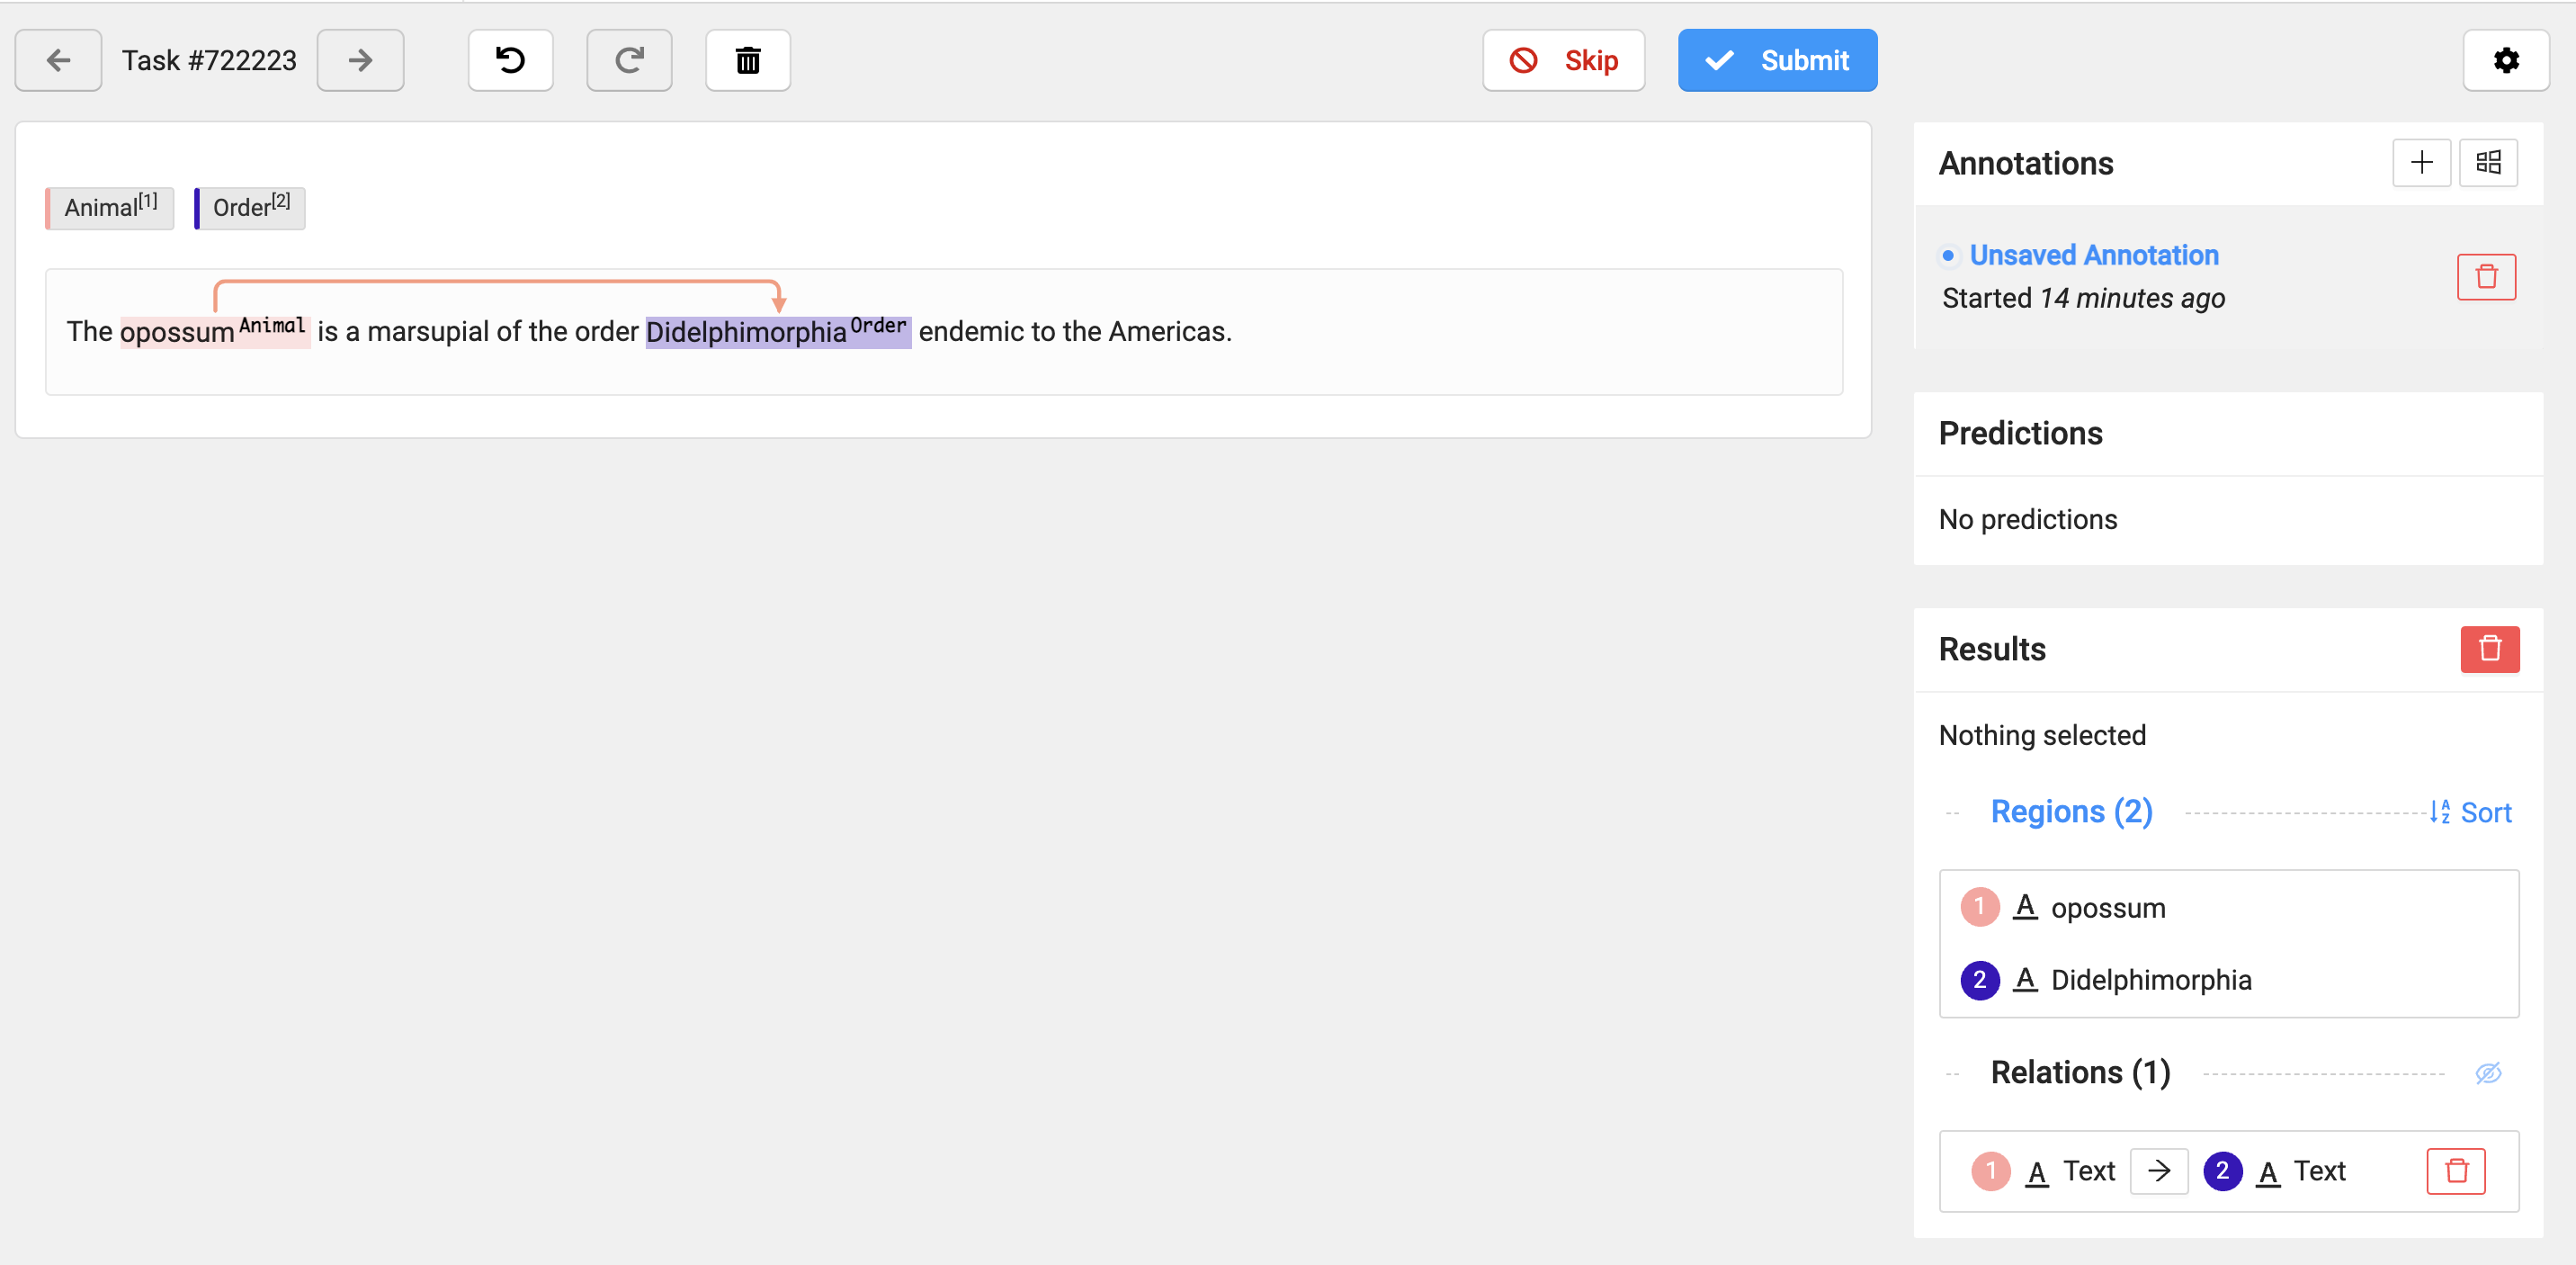 Figure 1: Add relations between annotations
After you relate two annotation regions, you can modify the relation in the Relations section of the Results sidebar.
- To change the direction of the relation, click the direction button between the two related regions.
- To add labels to the direction arrow indicating the relation between two annotations, click the vertical ellipsis button next to the two related regions to add your predefined labels. You must have a label configuration that includes relations to do this.
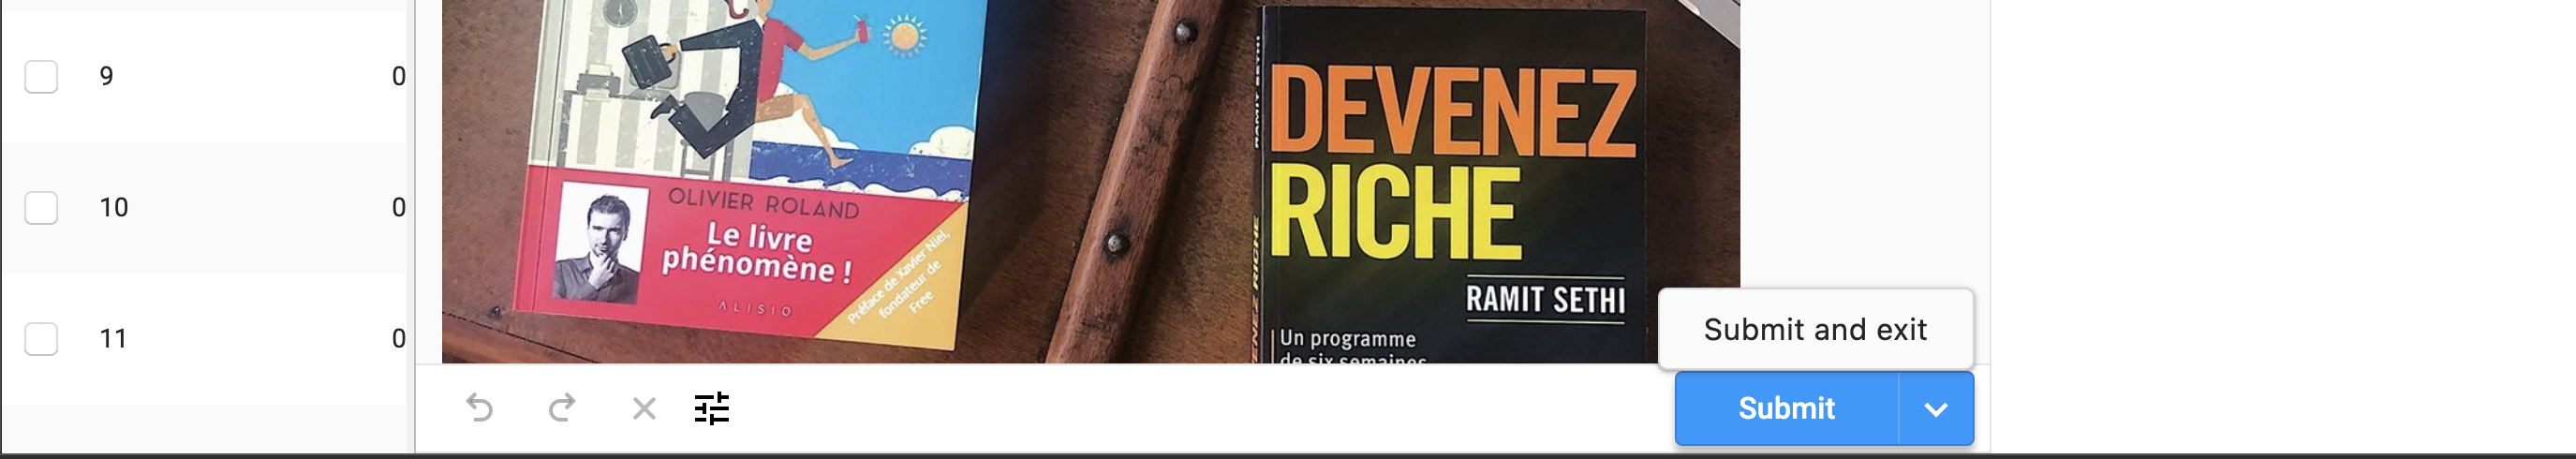
Exiting a labeling flow
When annotators are not finished with their annotation work but would like to exit their labeling flow to, for example, pause the lead time calculation on their annotations, they can click the drop-down menu next to Submit and then select Submit and Exit (or Update and Exit). This will submit the current annotation and redirect them to the Projects page.
If they are not done with their annotation, then they can simply check to make sure their draft was saved in the history panel and then navigate to the Projects page to stop the lead time calculation from running.
Label with collaborators
In both Label Studio and Label Studio Enterprise, you can label tasks with collaborators. Tasks are locked while someone performs annotations so that you don’t accidentally overwrite the annotations of another annotator. After the other annotator finishes with the task, it can appear in your queue for labeling if the minimum annotations per task is set to more than one. By default, tasks only need to be annotated by one annotator.
If you want to label tasks more than once, even if the minimum annotations required is set to one, do the following:
To label tasks multiple times while the minimum annotations required is set to one, do the following:
- In the data manager for the project, click a task to open the quick labeling view.
- Click the
+icon next to the task annotation ID to open an annotation tab. - Label the task.
- Click Submit to save your annotation.
- Click the next task in the data manager to open the quick labeling view for that task and repeat steps 2-4.
Perform ML-assisted labeling with interactive preannotations
If you have a machine learning backend set up to get interactive preannotations, you can choose whether to use those predictions while you label.
- After you start labeling, you can enable Auto-Annotation to see and use the smart option to assign a label to draw a shape, mask, or assign a keypoint. After using the smart option to draw on an image, or labeling a text or HTML span, the ML backend returns predictions.
- For image labeling, you can choose whether to Auto accept annotation suggestions after you enable auto-annotation. If you automatically accept annotation suggestions, regions show up automatically and are immediately created. If you don’t automatically accept suggestions, the regions appear, but you can reject or approve them manually, either individually or all at once. Predicted text regions are automatically accepted.
Customize the labeling interface
Click the settings icon when labeling to configure the labeling interface to suit your labeling use case.
For example, keep a label selected after creating a region, display labels on bounding boxes, polygons and other regions while labeling, and show line numbers for text labeling.
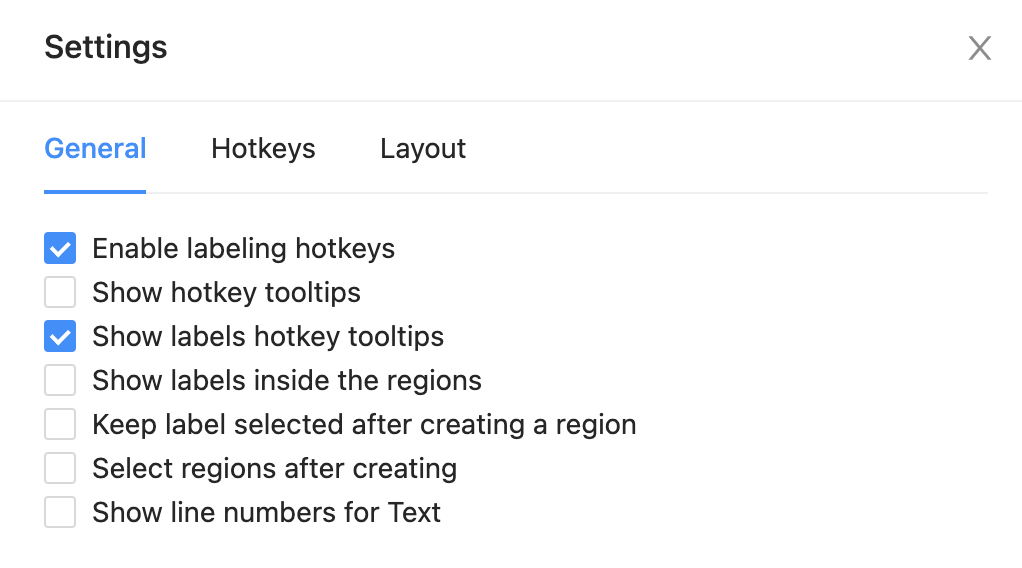
Figure 2: Customize the labeling interface
You can also modify the layout of the screen, hide or show predictions, annotations, or the results panel, and hide or show various controls and buttons.
Advanced image labeling
If you want to perform advanced image labeling, follow these examples and guidance for assistance.
Add multiple types of regions to image annotations
You can add multiple types of regions to image annotations. You can add any of the following:
- Rectangles
- Ellipses
- Keypoints
- Polygons
- Brush masks
To add different types of regions to your image annotations, follow this example.
Create a custom template for your labeling interface using the following example:
<View>
  <Image name="image" value="$image" />
  <Rectangle name="rect" toName="image" />
  <Ellipse name="ellipse" toName="image" />
  <KeyPoint name="kp" toName="image" />
  <Polygon name="polygon" toName="image" />
  <Brush name="brush" toName="image" />
  <Choices name="choices" toName="image">
    <Choice value="yes"></Choice>
    <Choice value="no"></Choice>
  </Choices>
  <Labels name="labels" toName="image" fillOpacity="0.5" strokeWidth="5">
    <Label value="building" background="green"></Label>
    <Label value="vehicle" background="blue"></Label>
  </Labels>
</View>
This example makes rectangles, ellipses, polygons, keypoints, and brush masks available to the annotator, along with image classification choices of yes and no, and region labels of building and vehicle.
Faster image labeling
You can add a rectangle or an ellipse to your image with just two clicks, or double click to create a polygon, rectangle, or ellipse.
If you accidentally select a point on an image while creating a polygon, just double click to remove the erroneous point and continue creating the region. There must be at least three points on the polygon to be able to remove a point.
Create regions without labels
When you’re annotating images, you can create regions without applying labels.
- Create a custom template using the example provided above under Add multiple types of regions to image annotations.
- Select which tool you want to use in the labeling toolbar. You only need to do this for the first task.
- Create a region by double-clicking or clicking and dragging to create a bounding box, or click the points necessary to construct a polygon.
- Select the created region in the sidebar or on the image.
- Select the label that you want to apply to the region.
- Repeat these steps for any regions that you want to create.
This can be helpful for two-step labeling, where you want one annotator to create regions and another annotator to label the regions.
Erase brush mask labels
If you make a mistake when labeling with the brush mask, you can erase it. You must select a brush region in the sidebar before you can erase any part of it.
If you want to completely remove a region and start over, delete the region instead of erasing it. Erasing a region does not delete it.
Outliner
The Outliner is a replacement for the existing interface with a multiple-panel approach. This feature improves the user experience to fit more data in these two columns (Outliner and Details) and provides more options when working with regions. For example, Image segmentation is the only type of labeling that supports custom controls on the details panel.
Feature capabilities
Outliner is the area where you can see all the details about annotation, regions, and labeling history. It is split into two panels, named Outliner and Details. Figure 3 shows the appearance of the Outliner panel on the right of the image and Details panel on the left of the image.
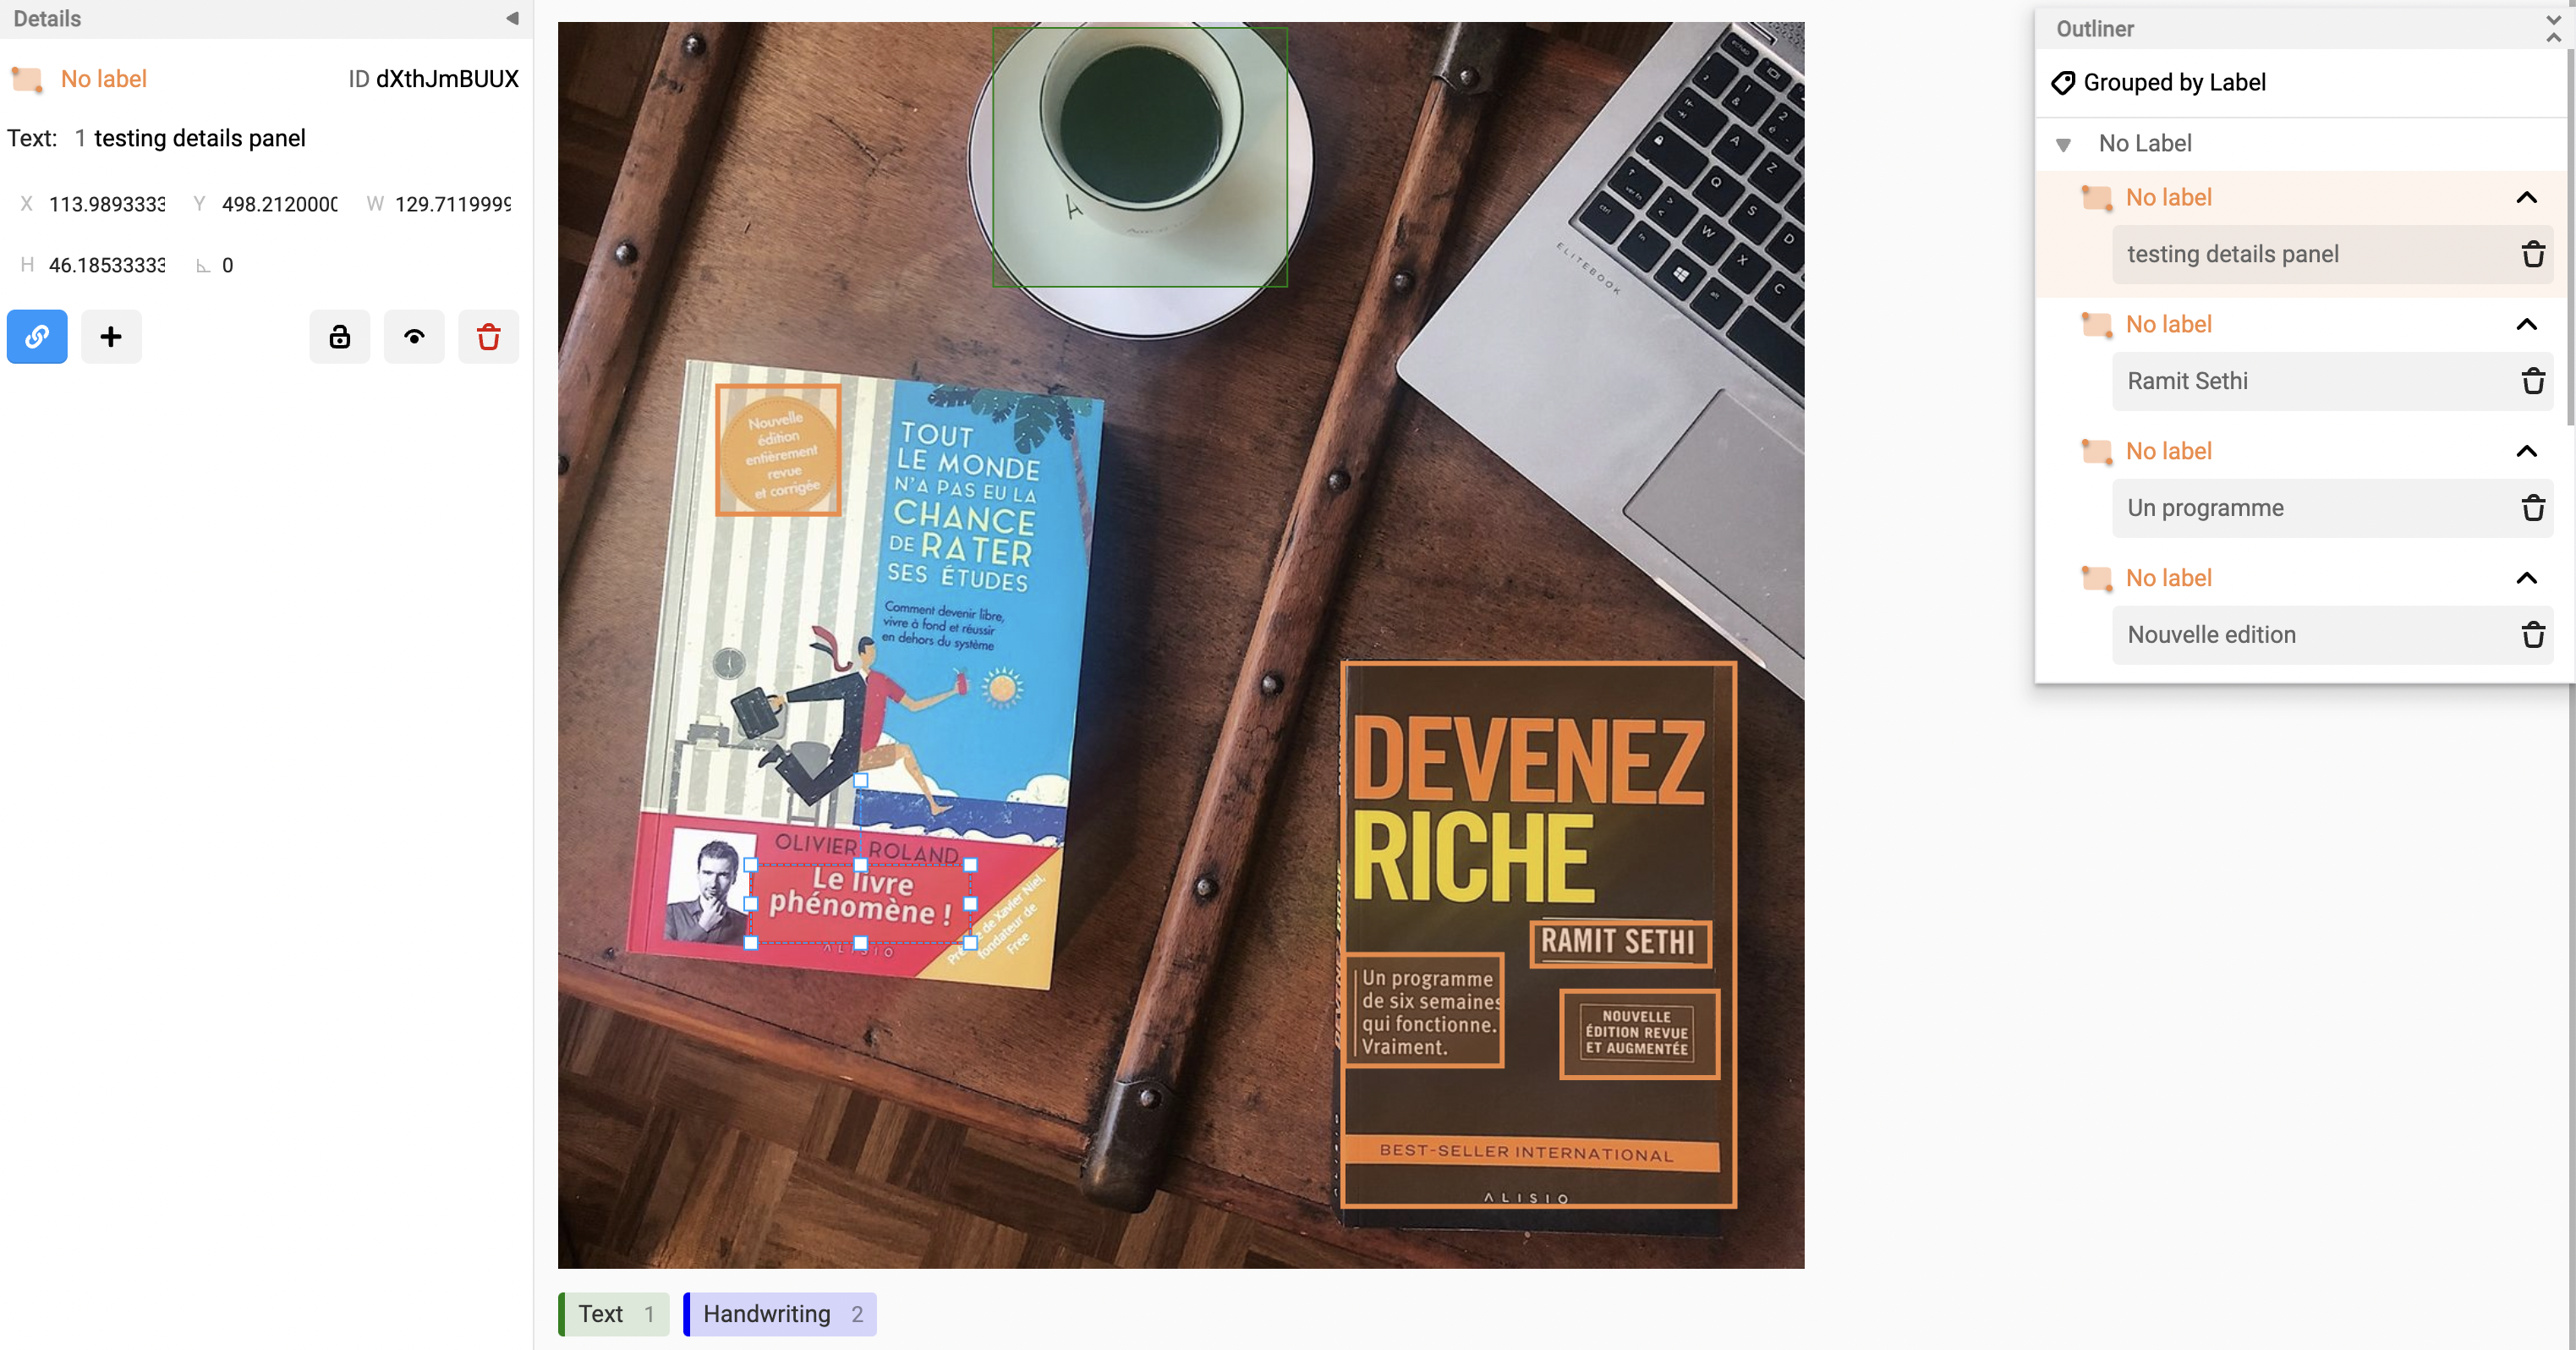 Figure 3: View of Outliner and Details panels view
Panel actions
There are two panels which is the outliner for the regions list. These panels can be collapsed, moved, swapped to the sides, dragged, dropped, and expanded to provide a full-screen view. For example, if you navigate to label stream, you will have more space in this mode.
The Outliner and Details panels are collapsible and detachable, so you can arrange them the way you want. Figure 4 shows the Collapse details button which allows you to collapse the Details panel and use the remaining portion of the screen.
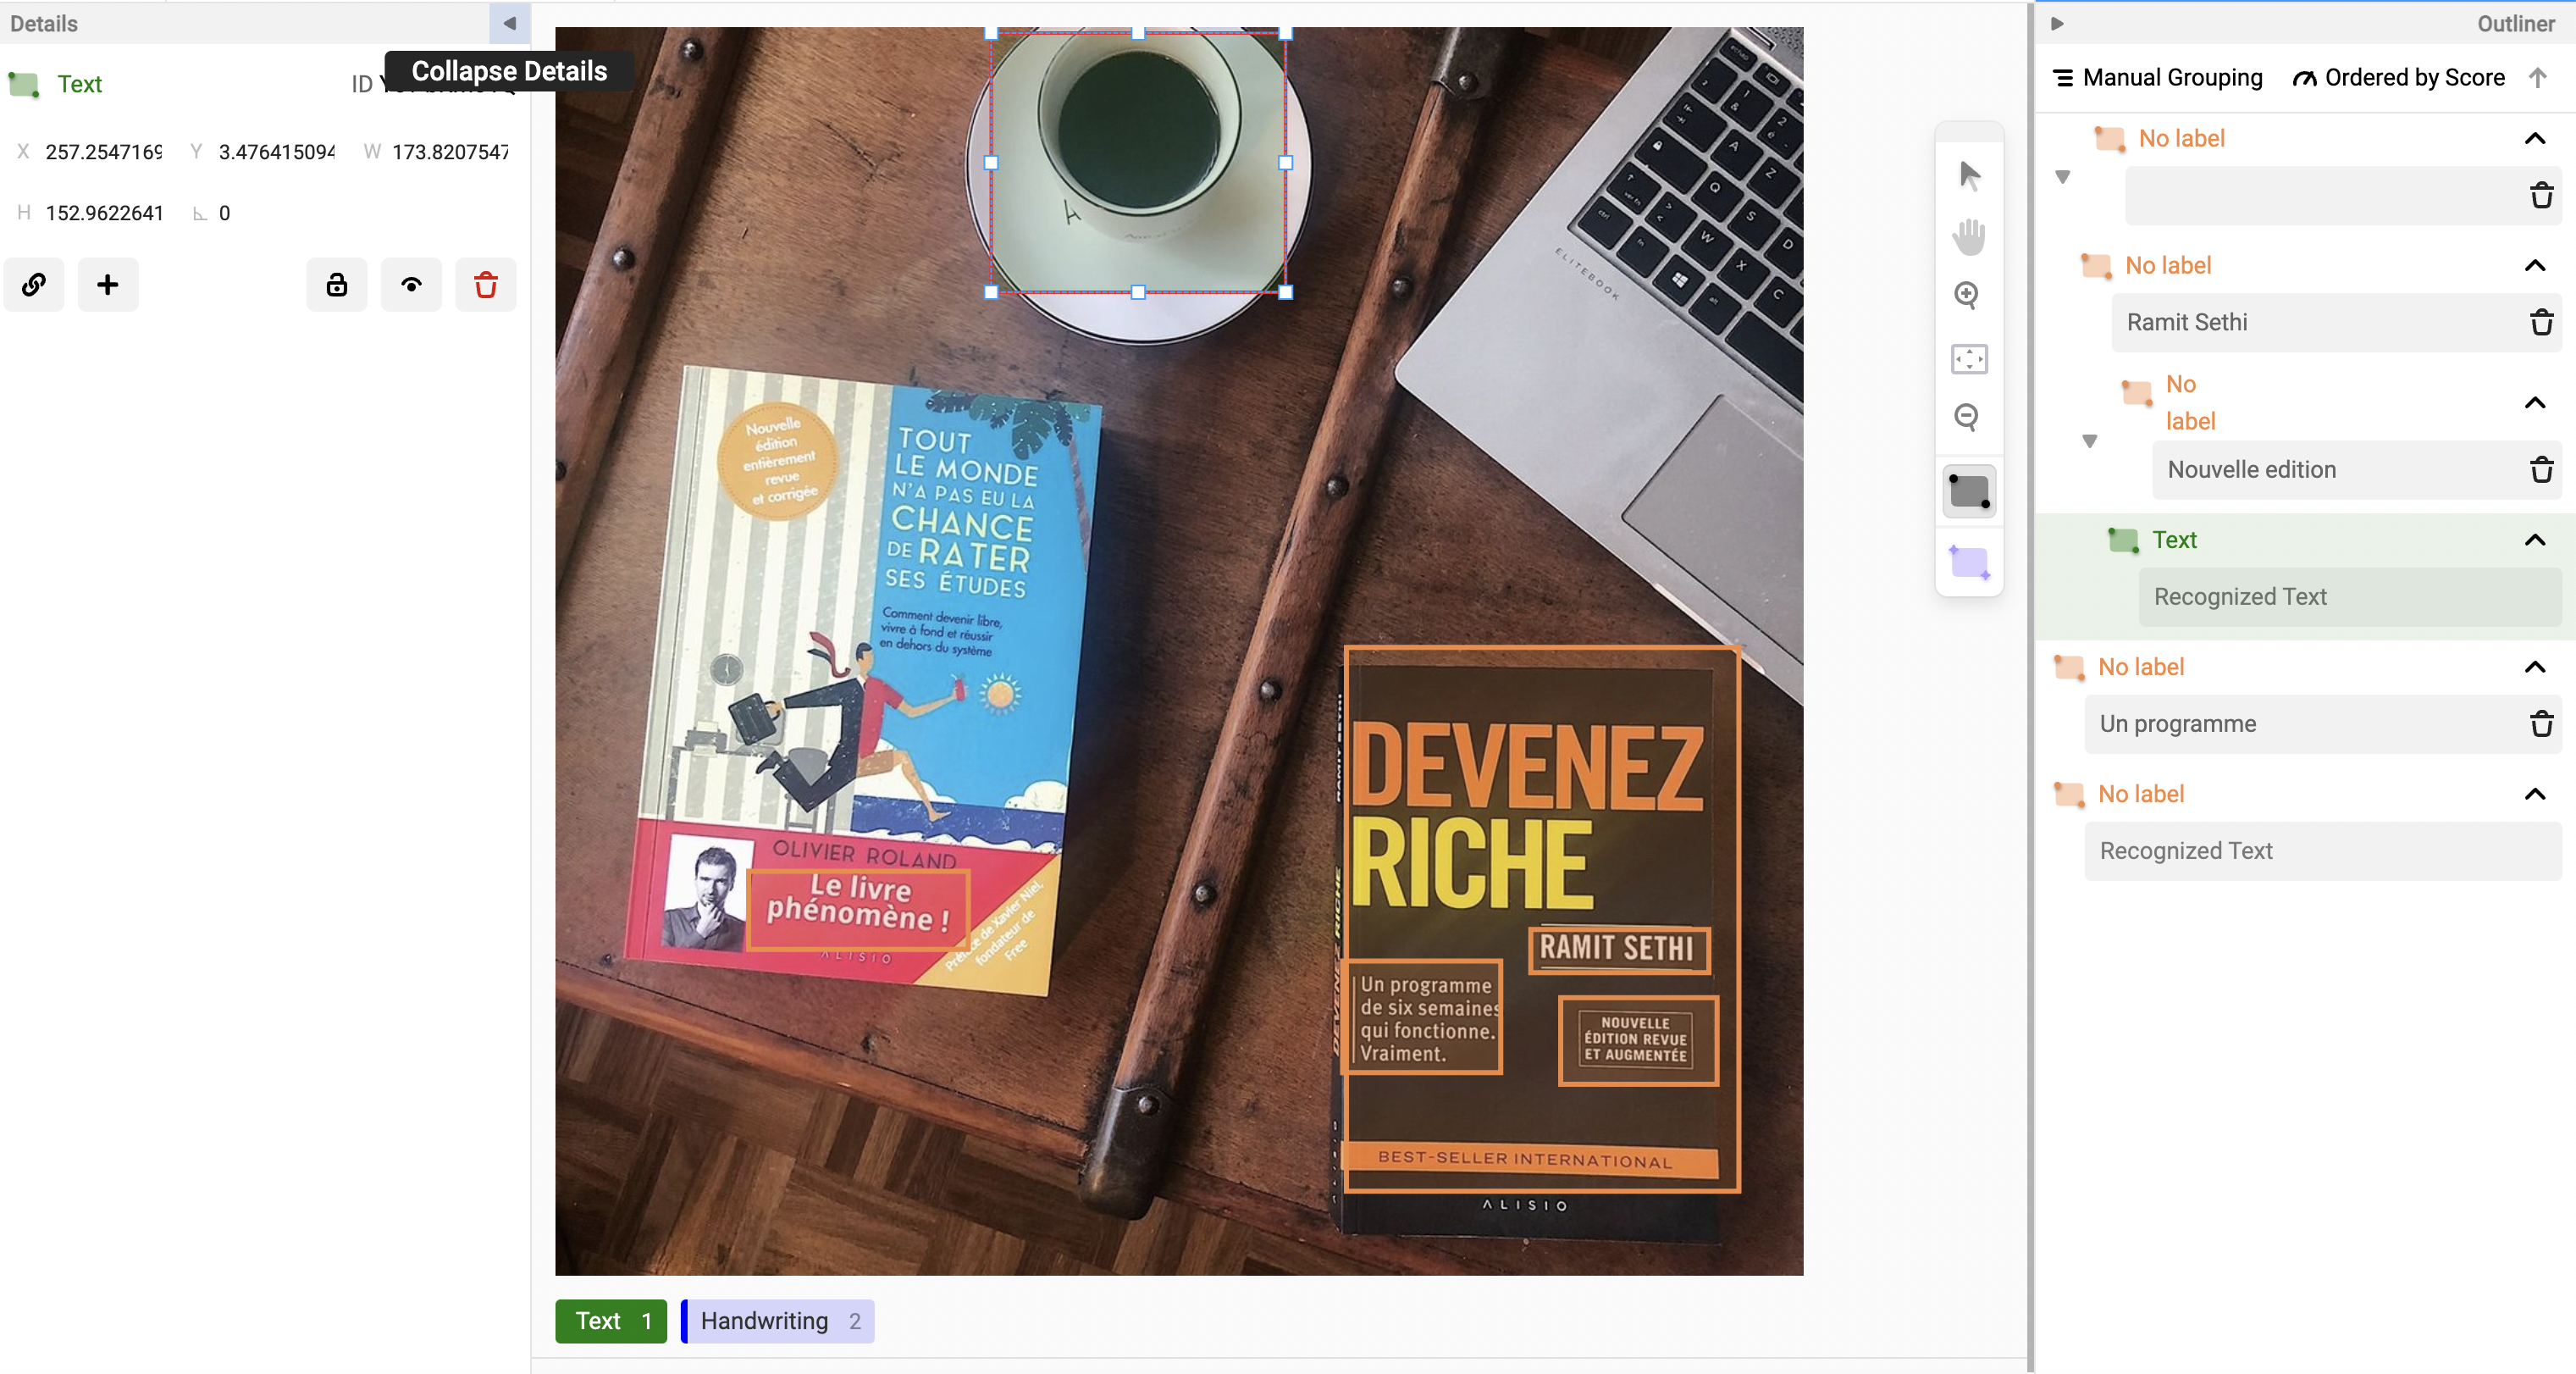 Figure 4: Collapsed details button
Now, the Details panel is collapsed, and you can expand it by clicking the Expand Details icon.
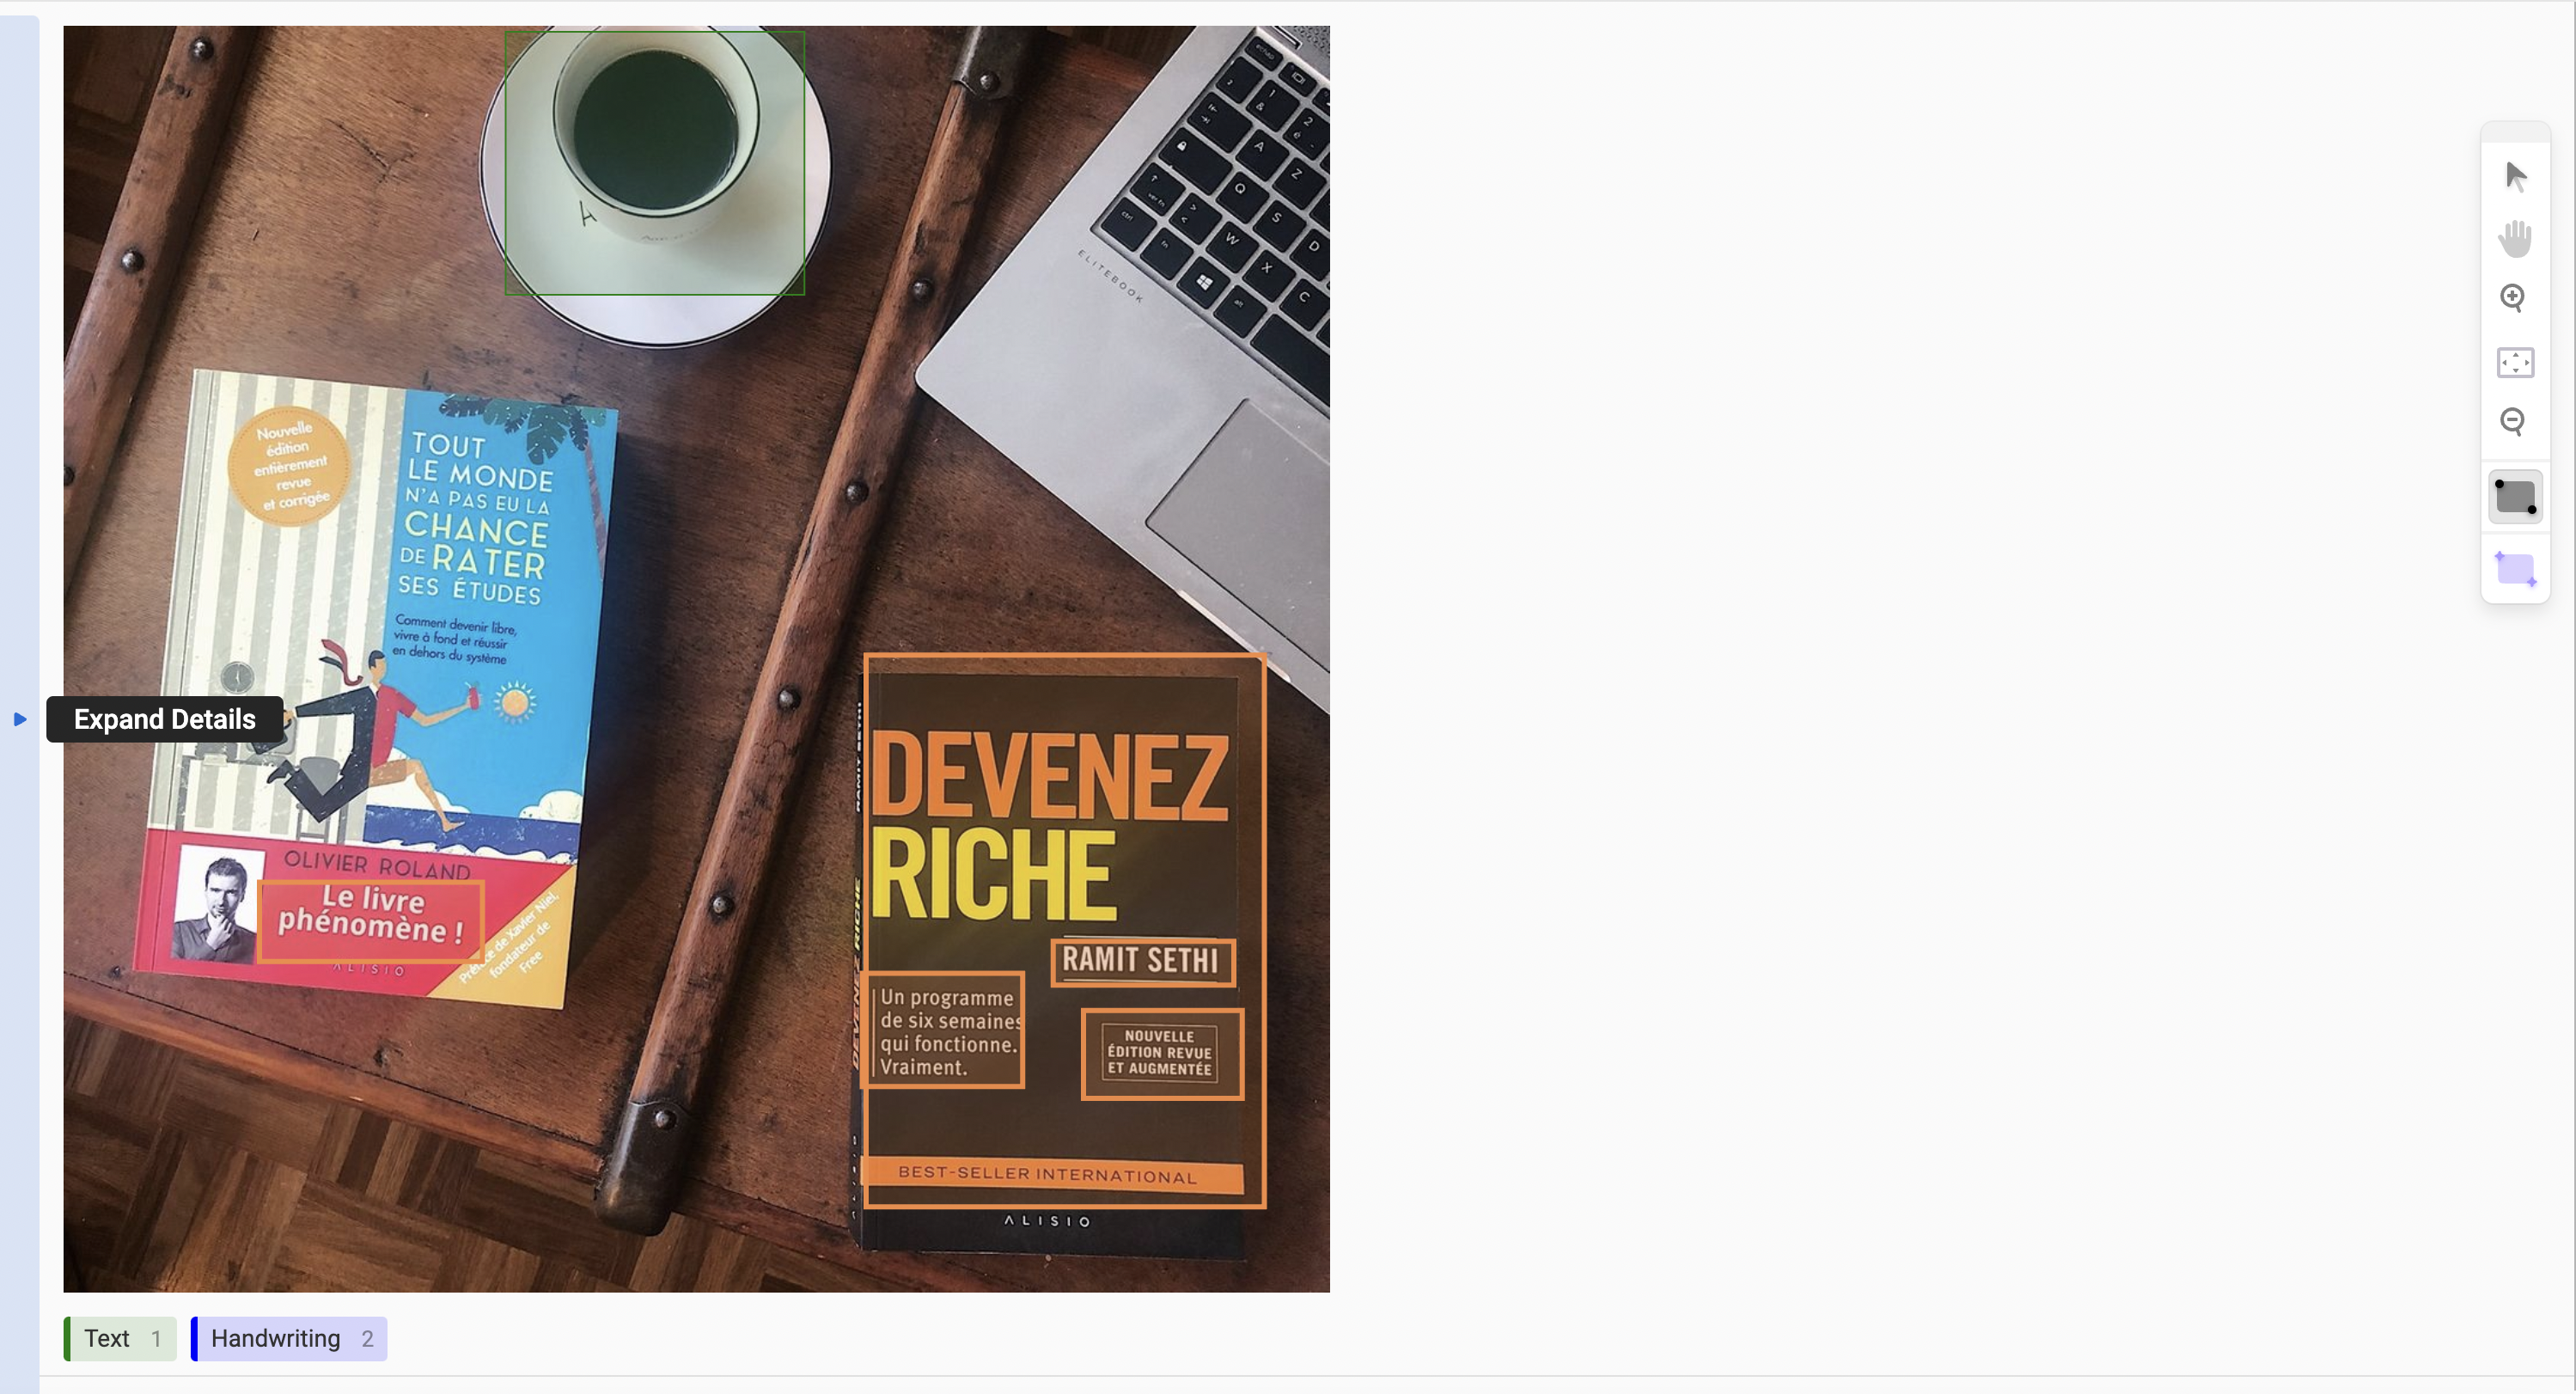 Figure 5: Details panel in collapsed view
The details panel is displayed in expanded view to explore the feature.
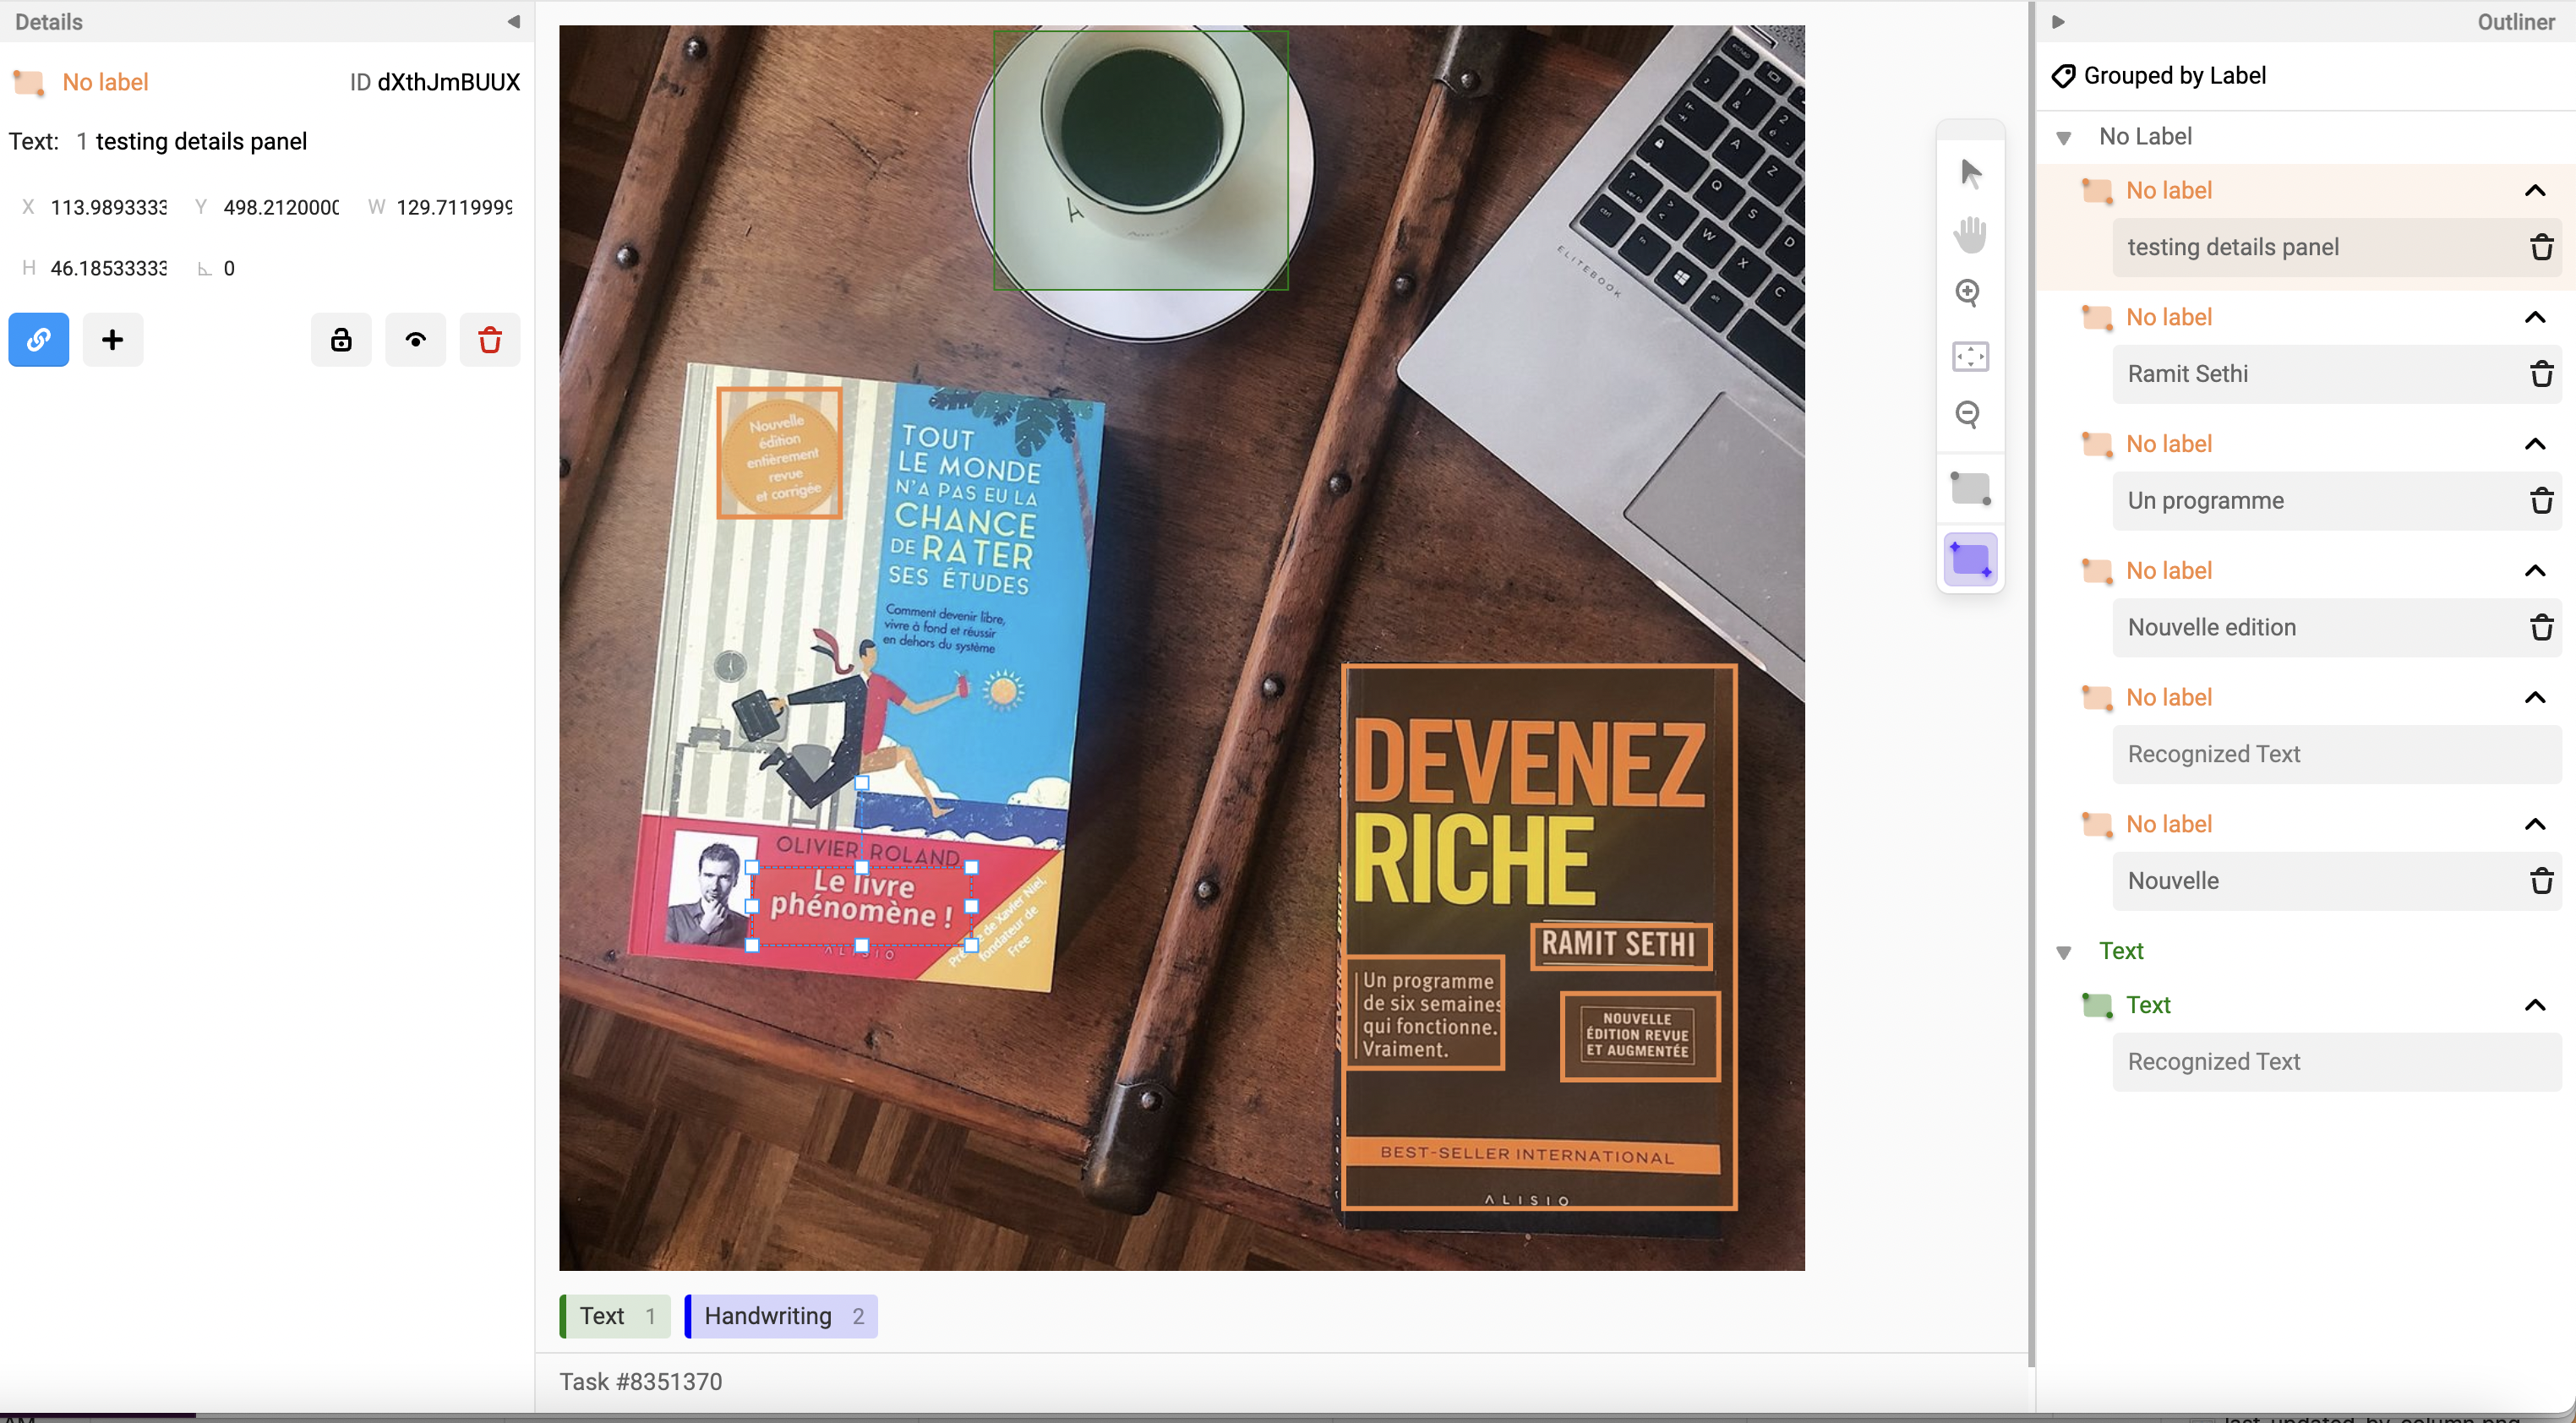 Figure 6: Details panel in expanded view
To collapse the Outliner panel, click on the Collapse outliner icon.
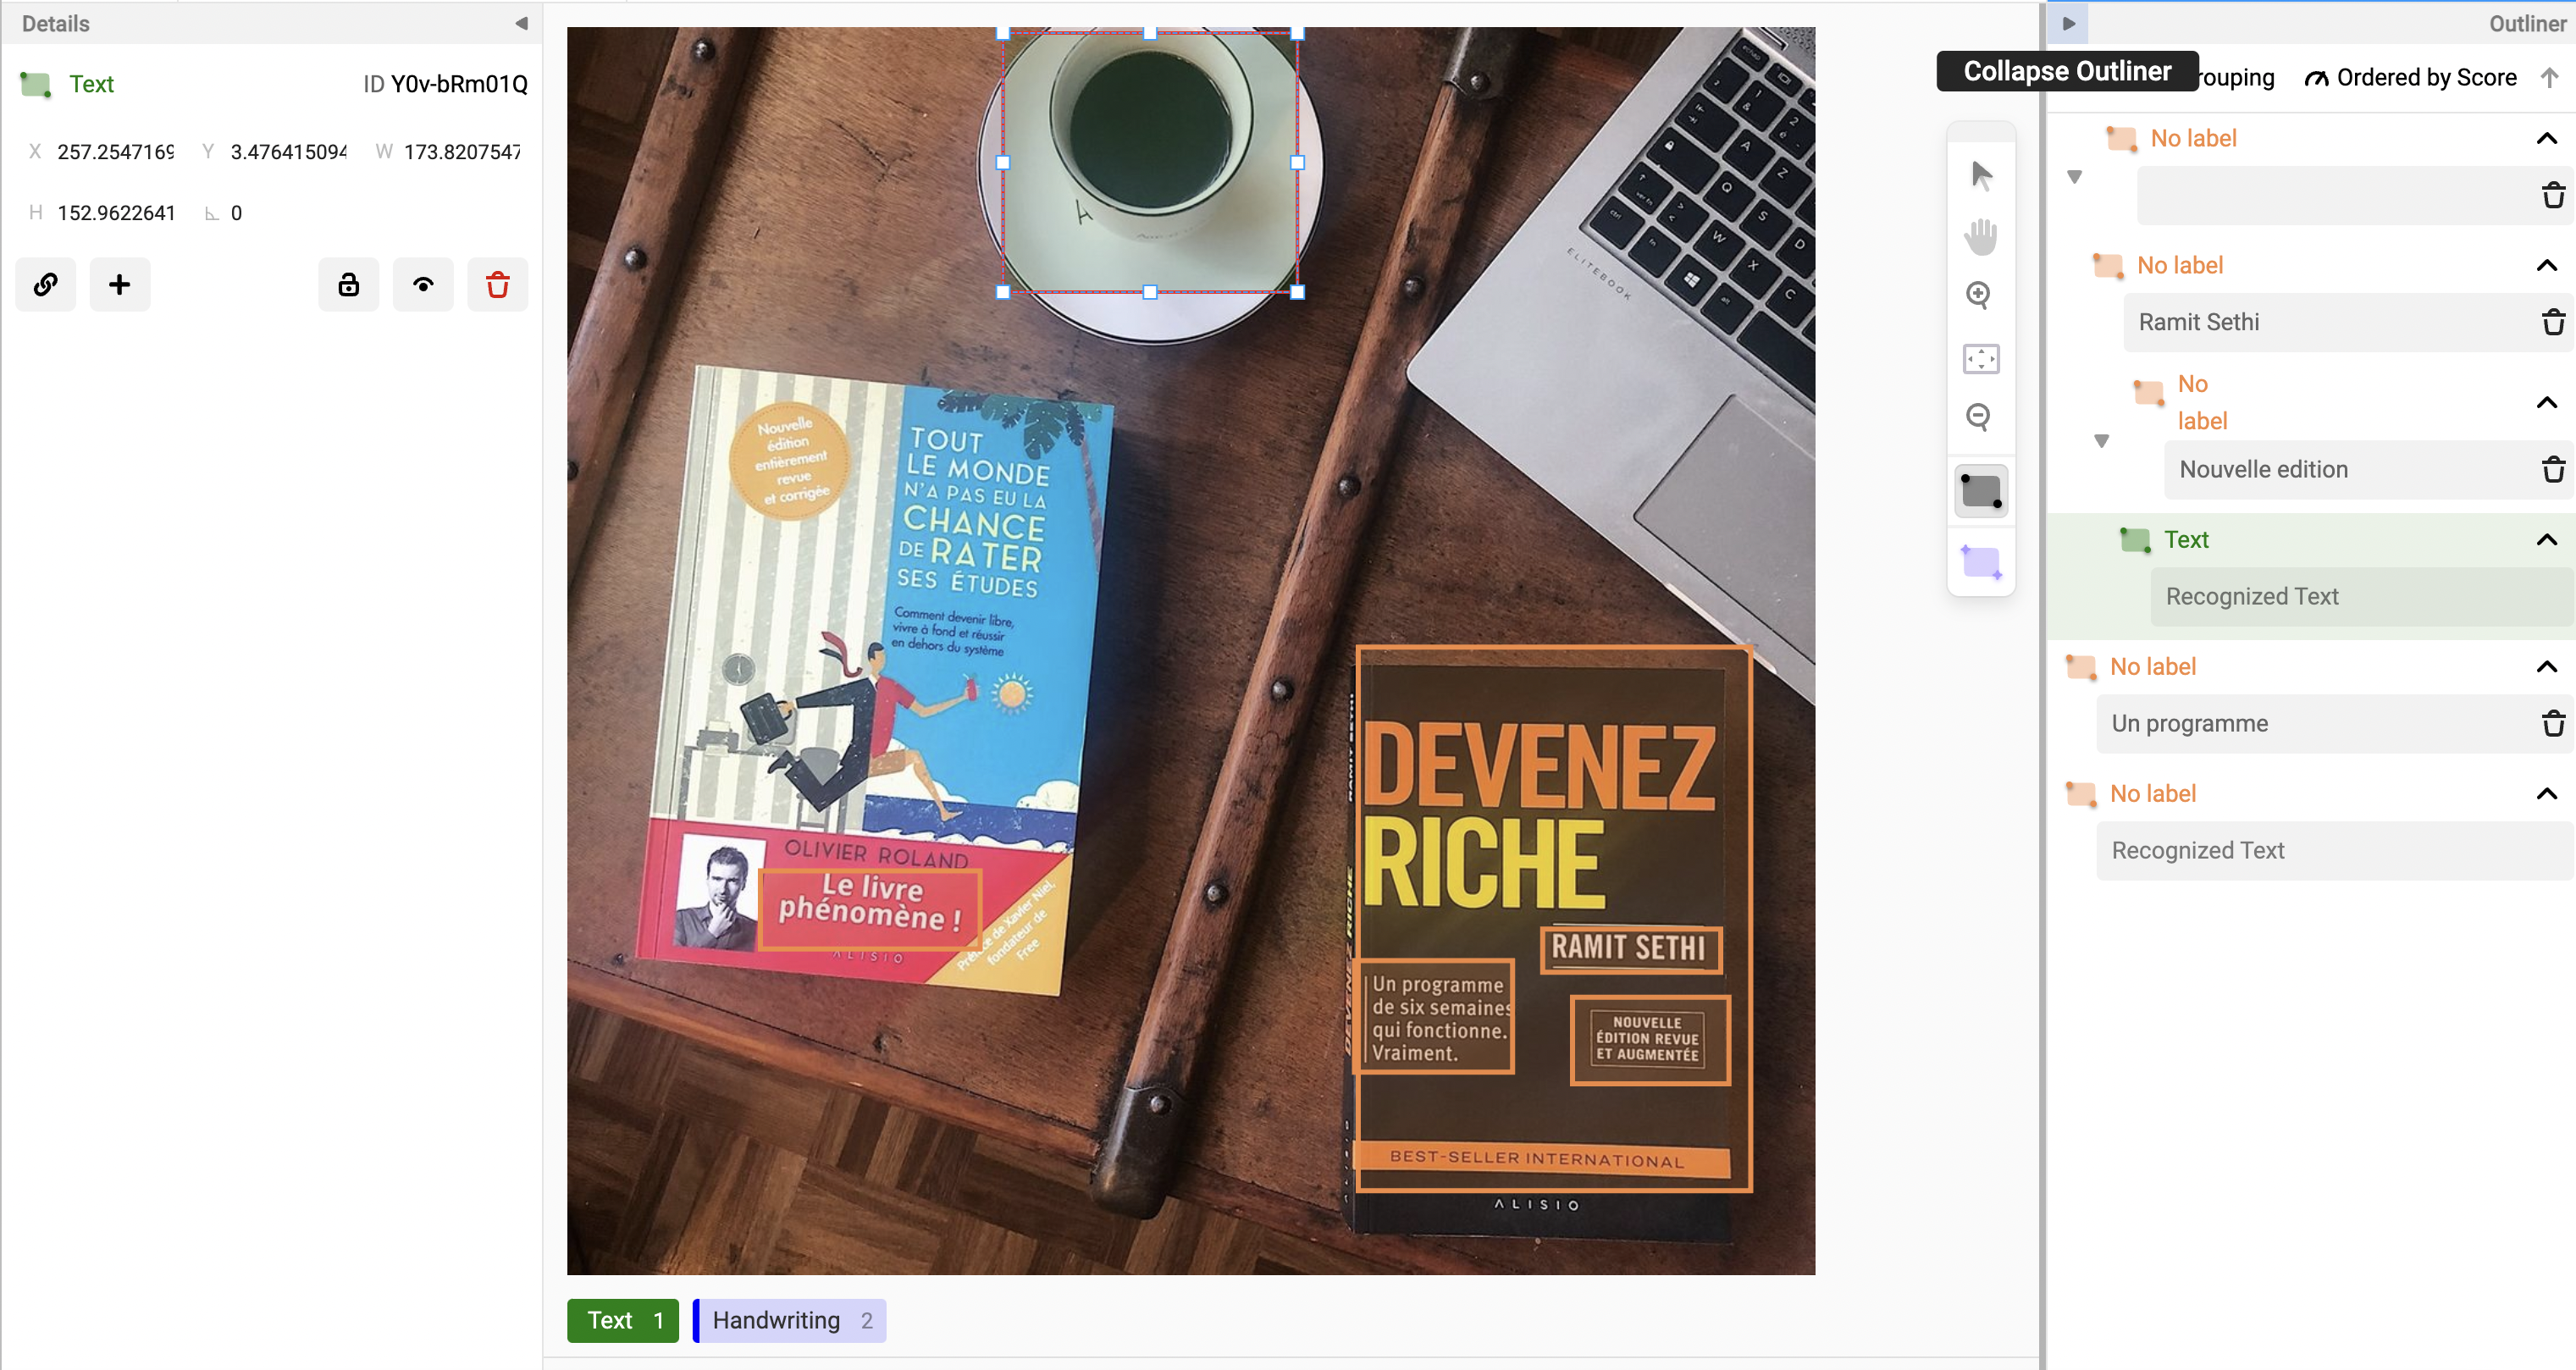 Figure 7: Collapse outliner button
Now, the Outliner panel is collapsed, and you can expand it by clicking the Expand Details icon.
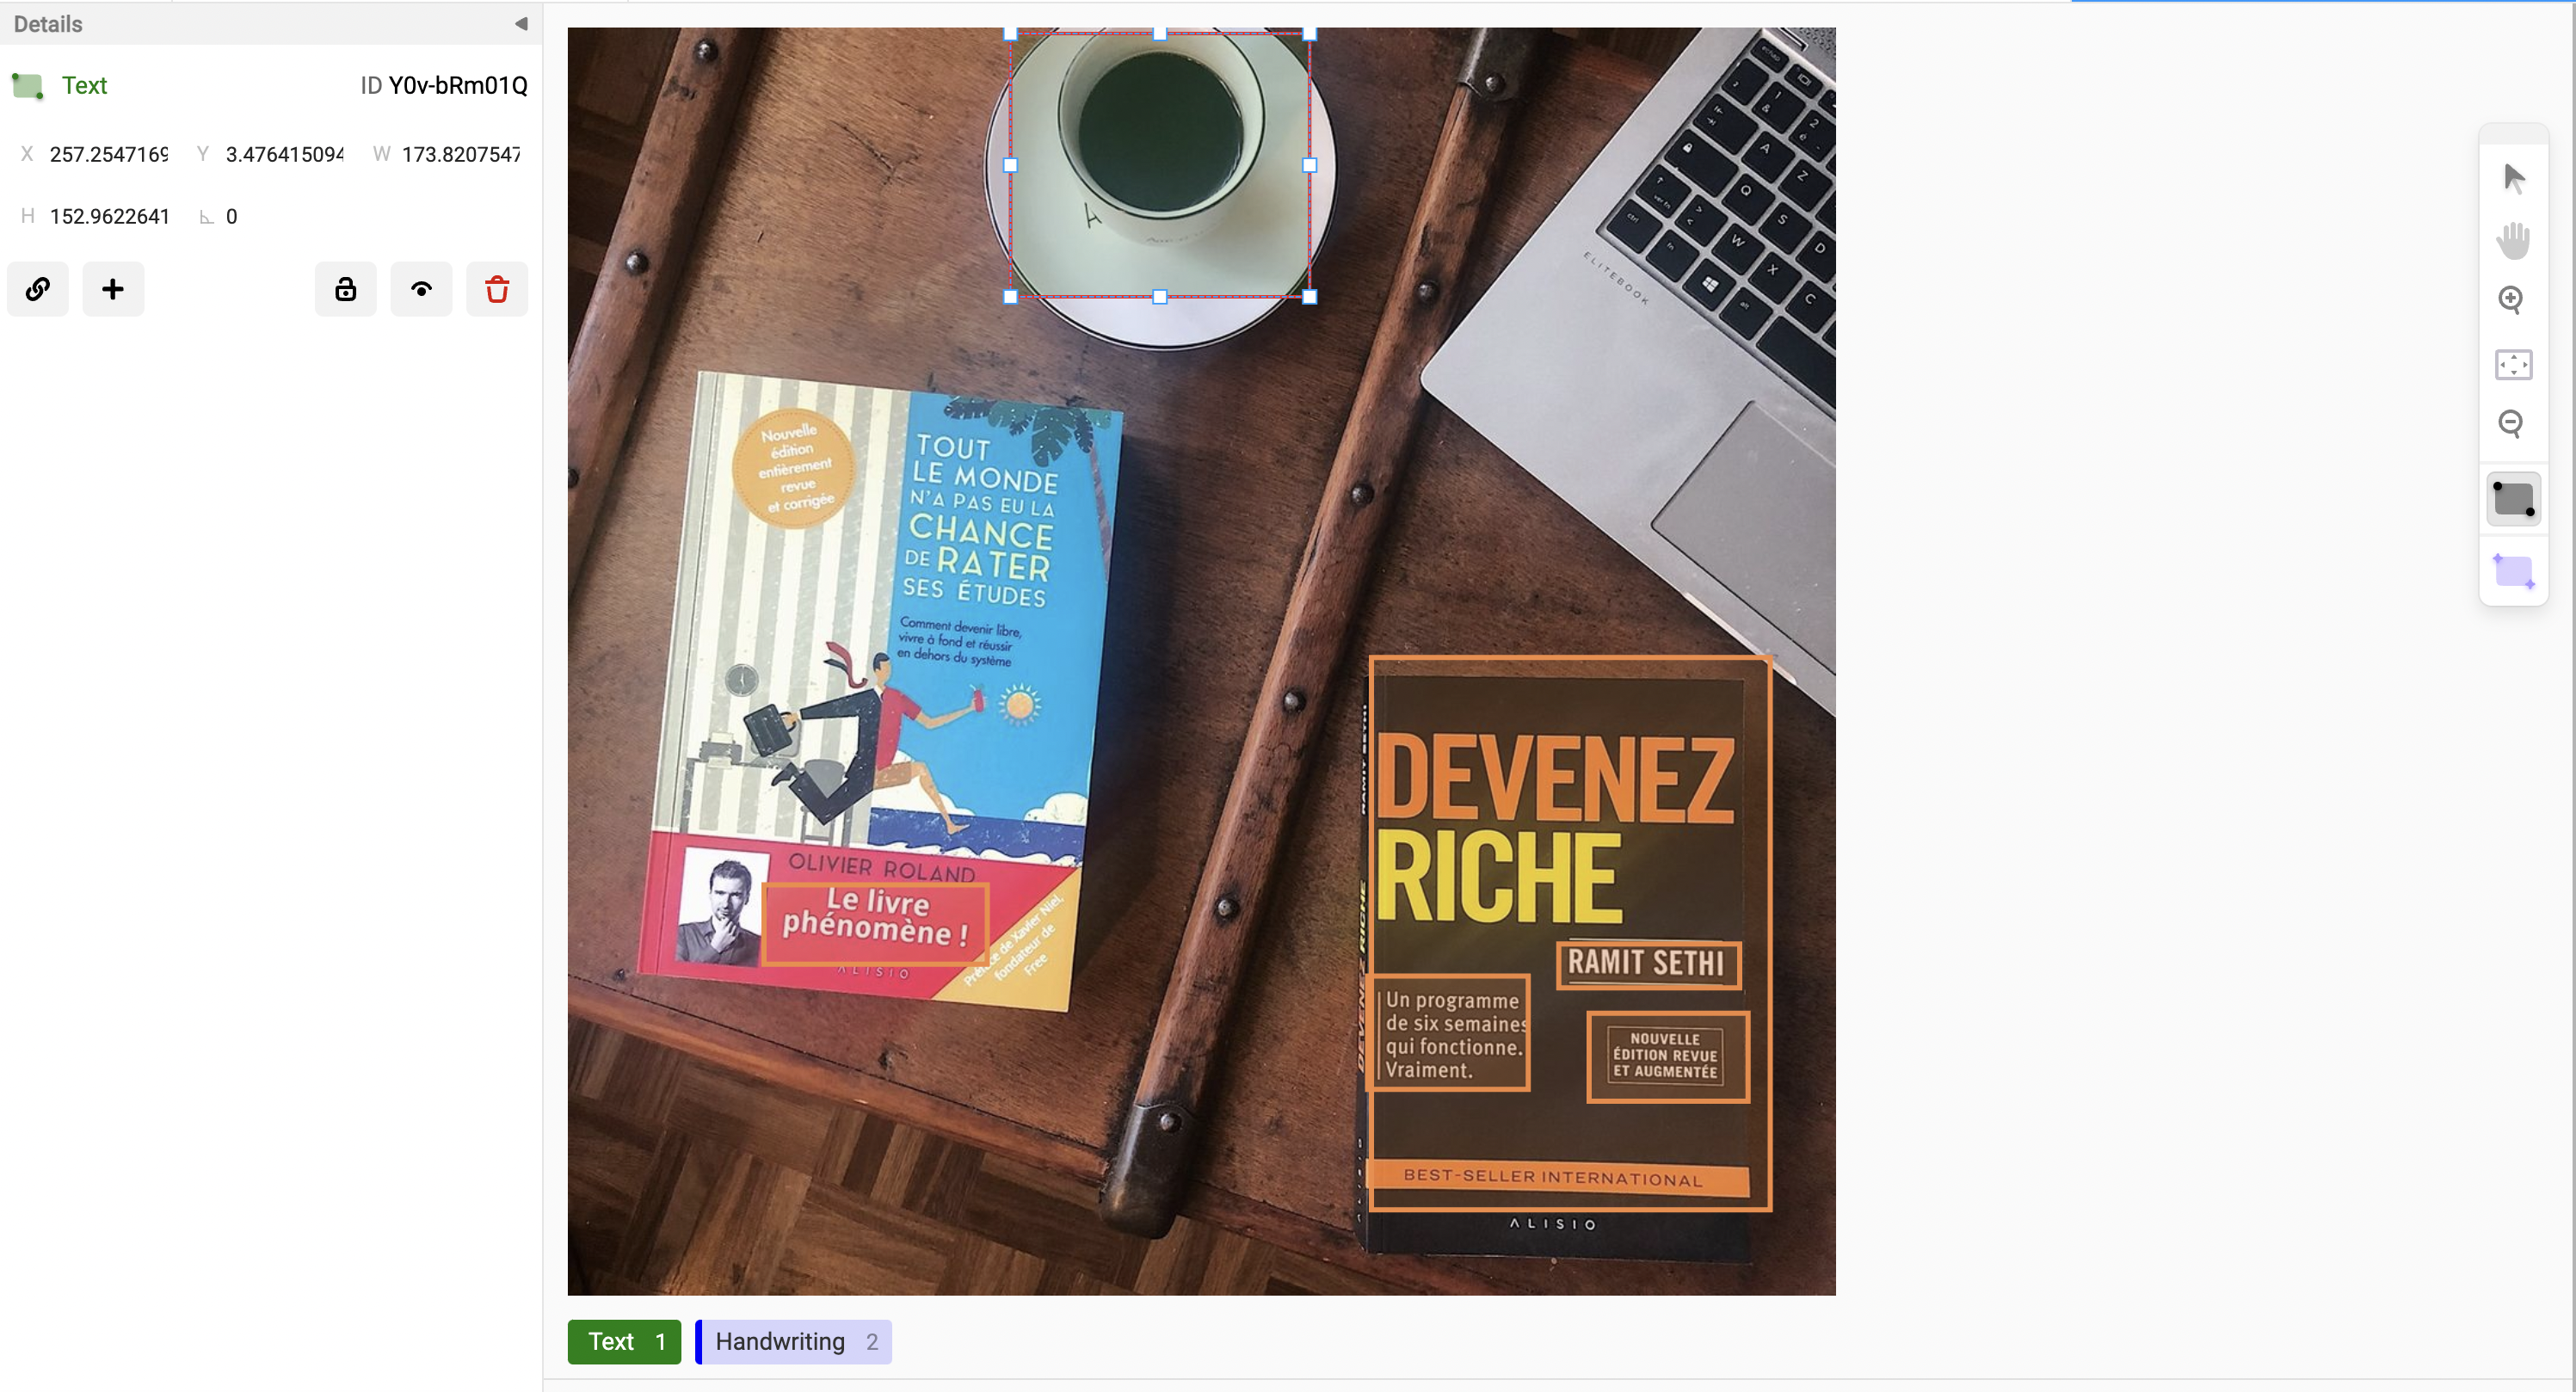 Figure 8: Outliner panel in collapsed view
The Expand Details icon expands the Outliner panel for further actions.
 Figure 9: Outliner panel with expand outliner icon
The Outliner panel is displayed in expanded view to explore the feature.
 Figure 10: Outliner panel in expanded view
These panels are detachable, so you can place them wherever you want on the screen, and you can resize them.
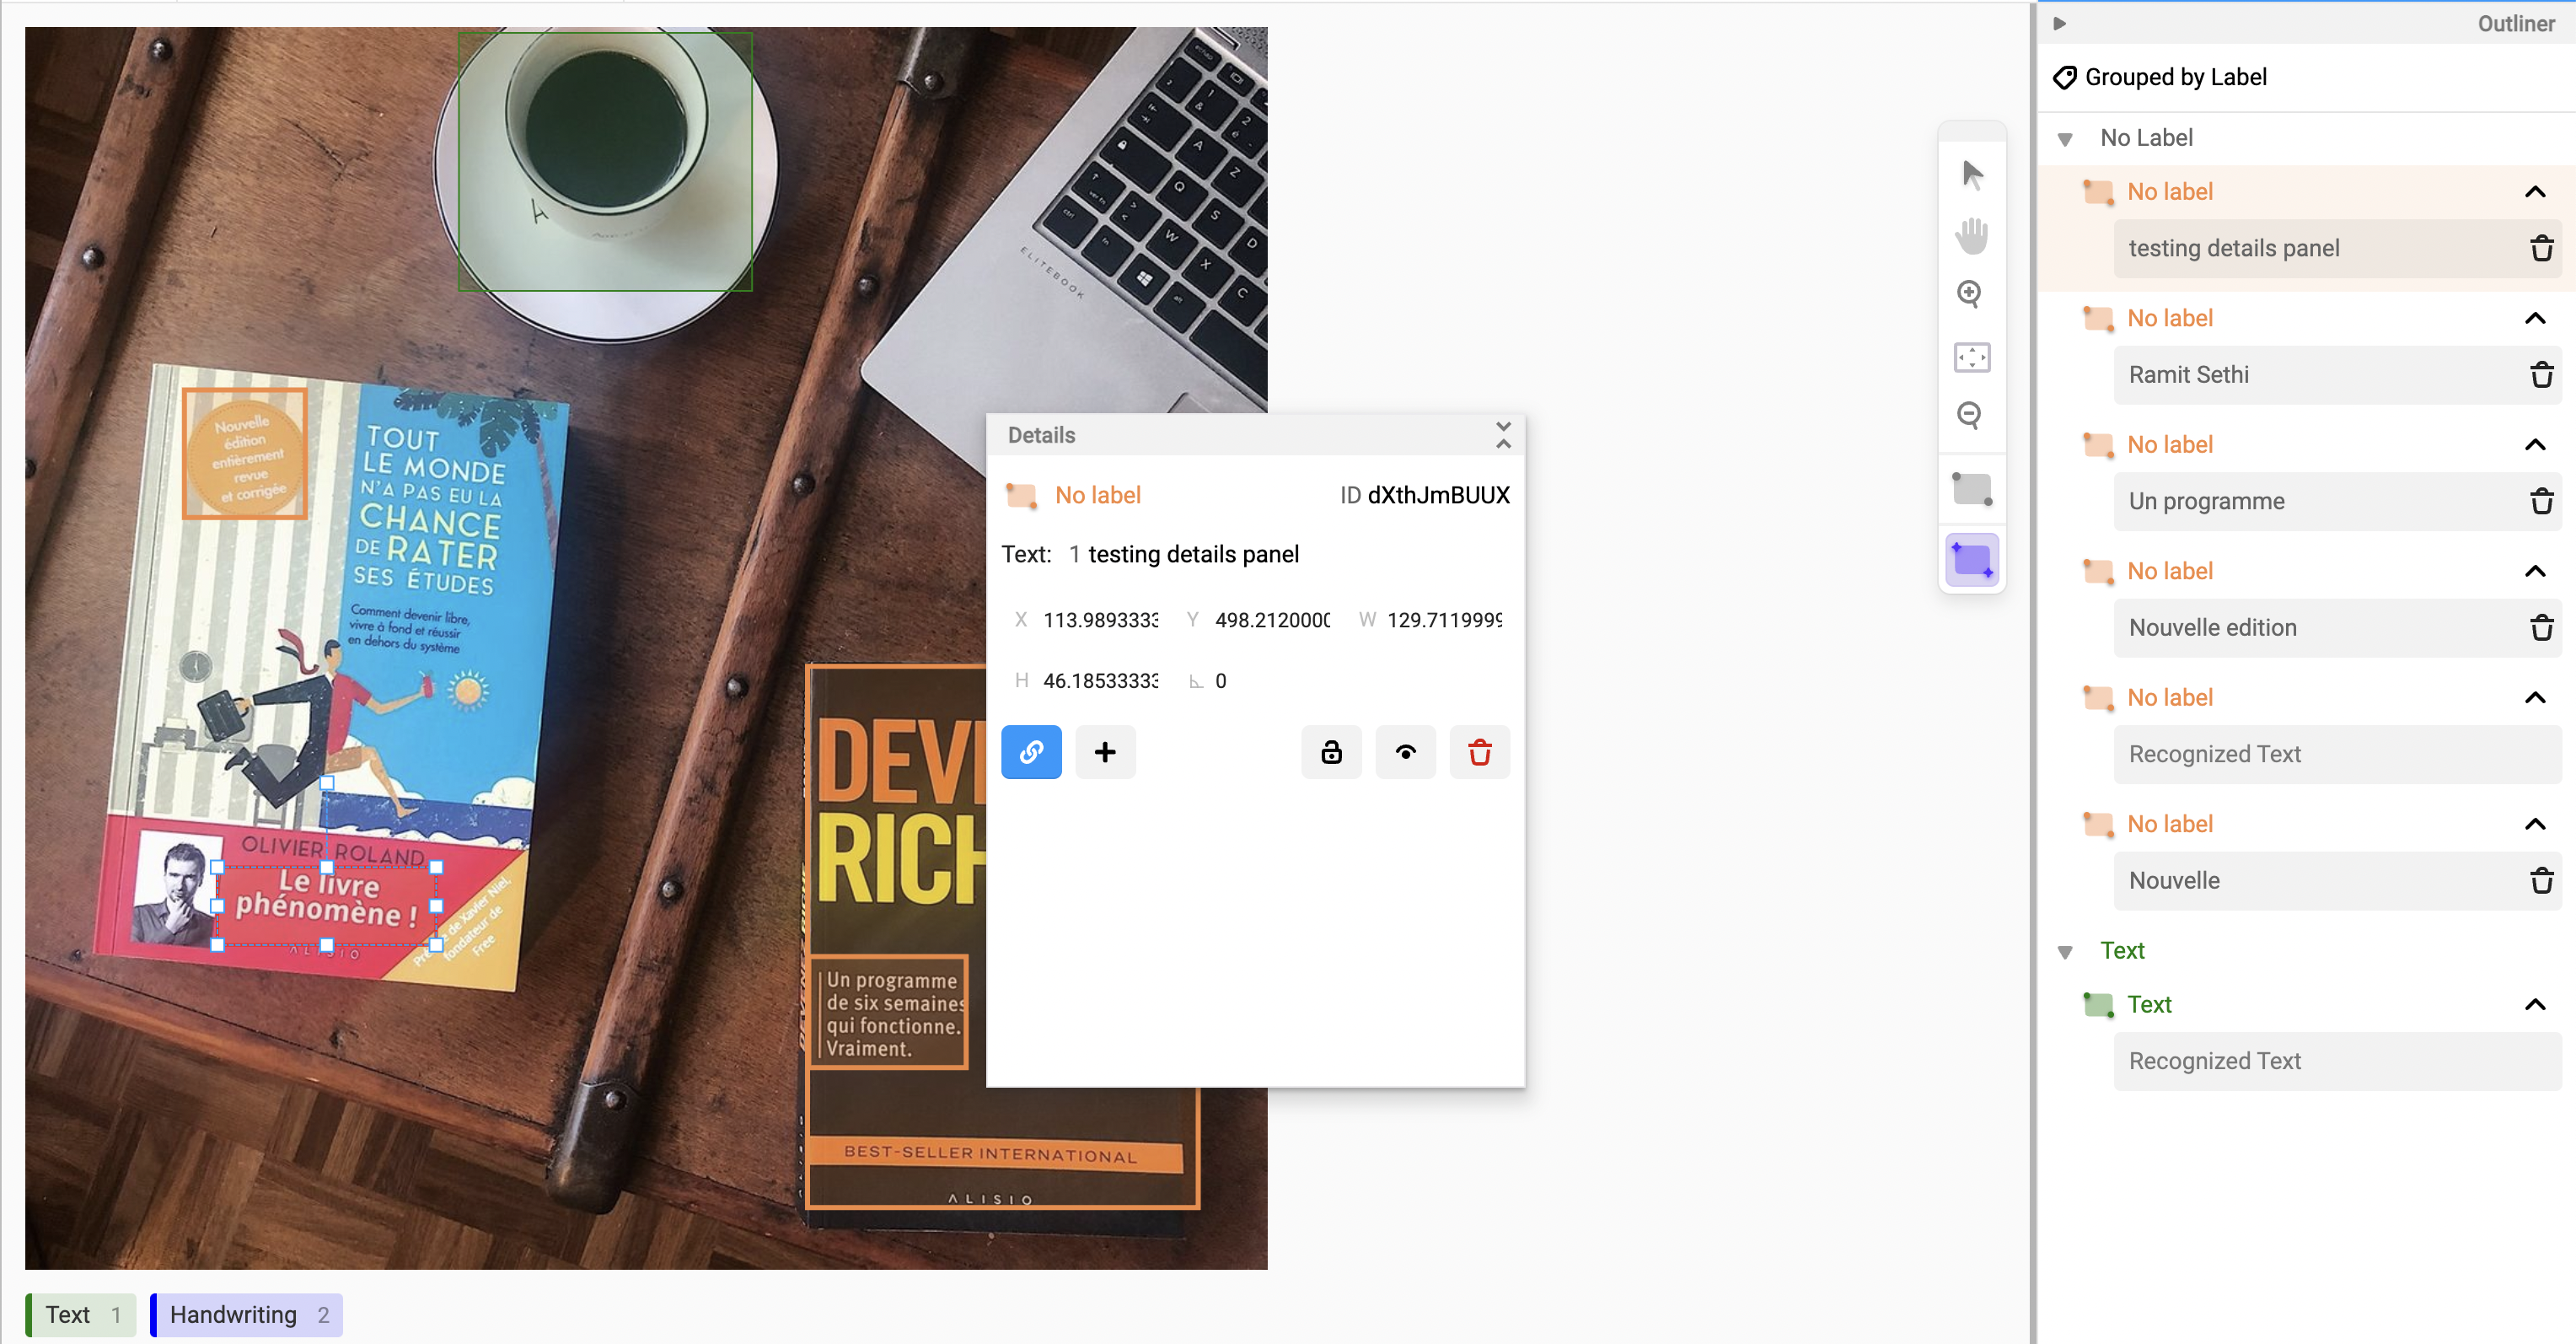 Figure 11: Details panel in floating dock view
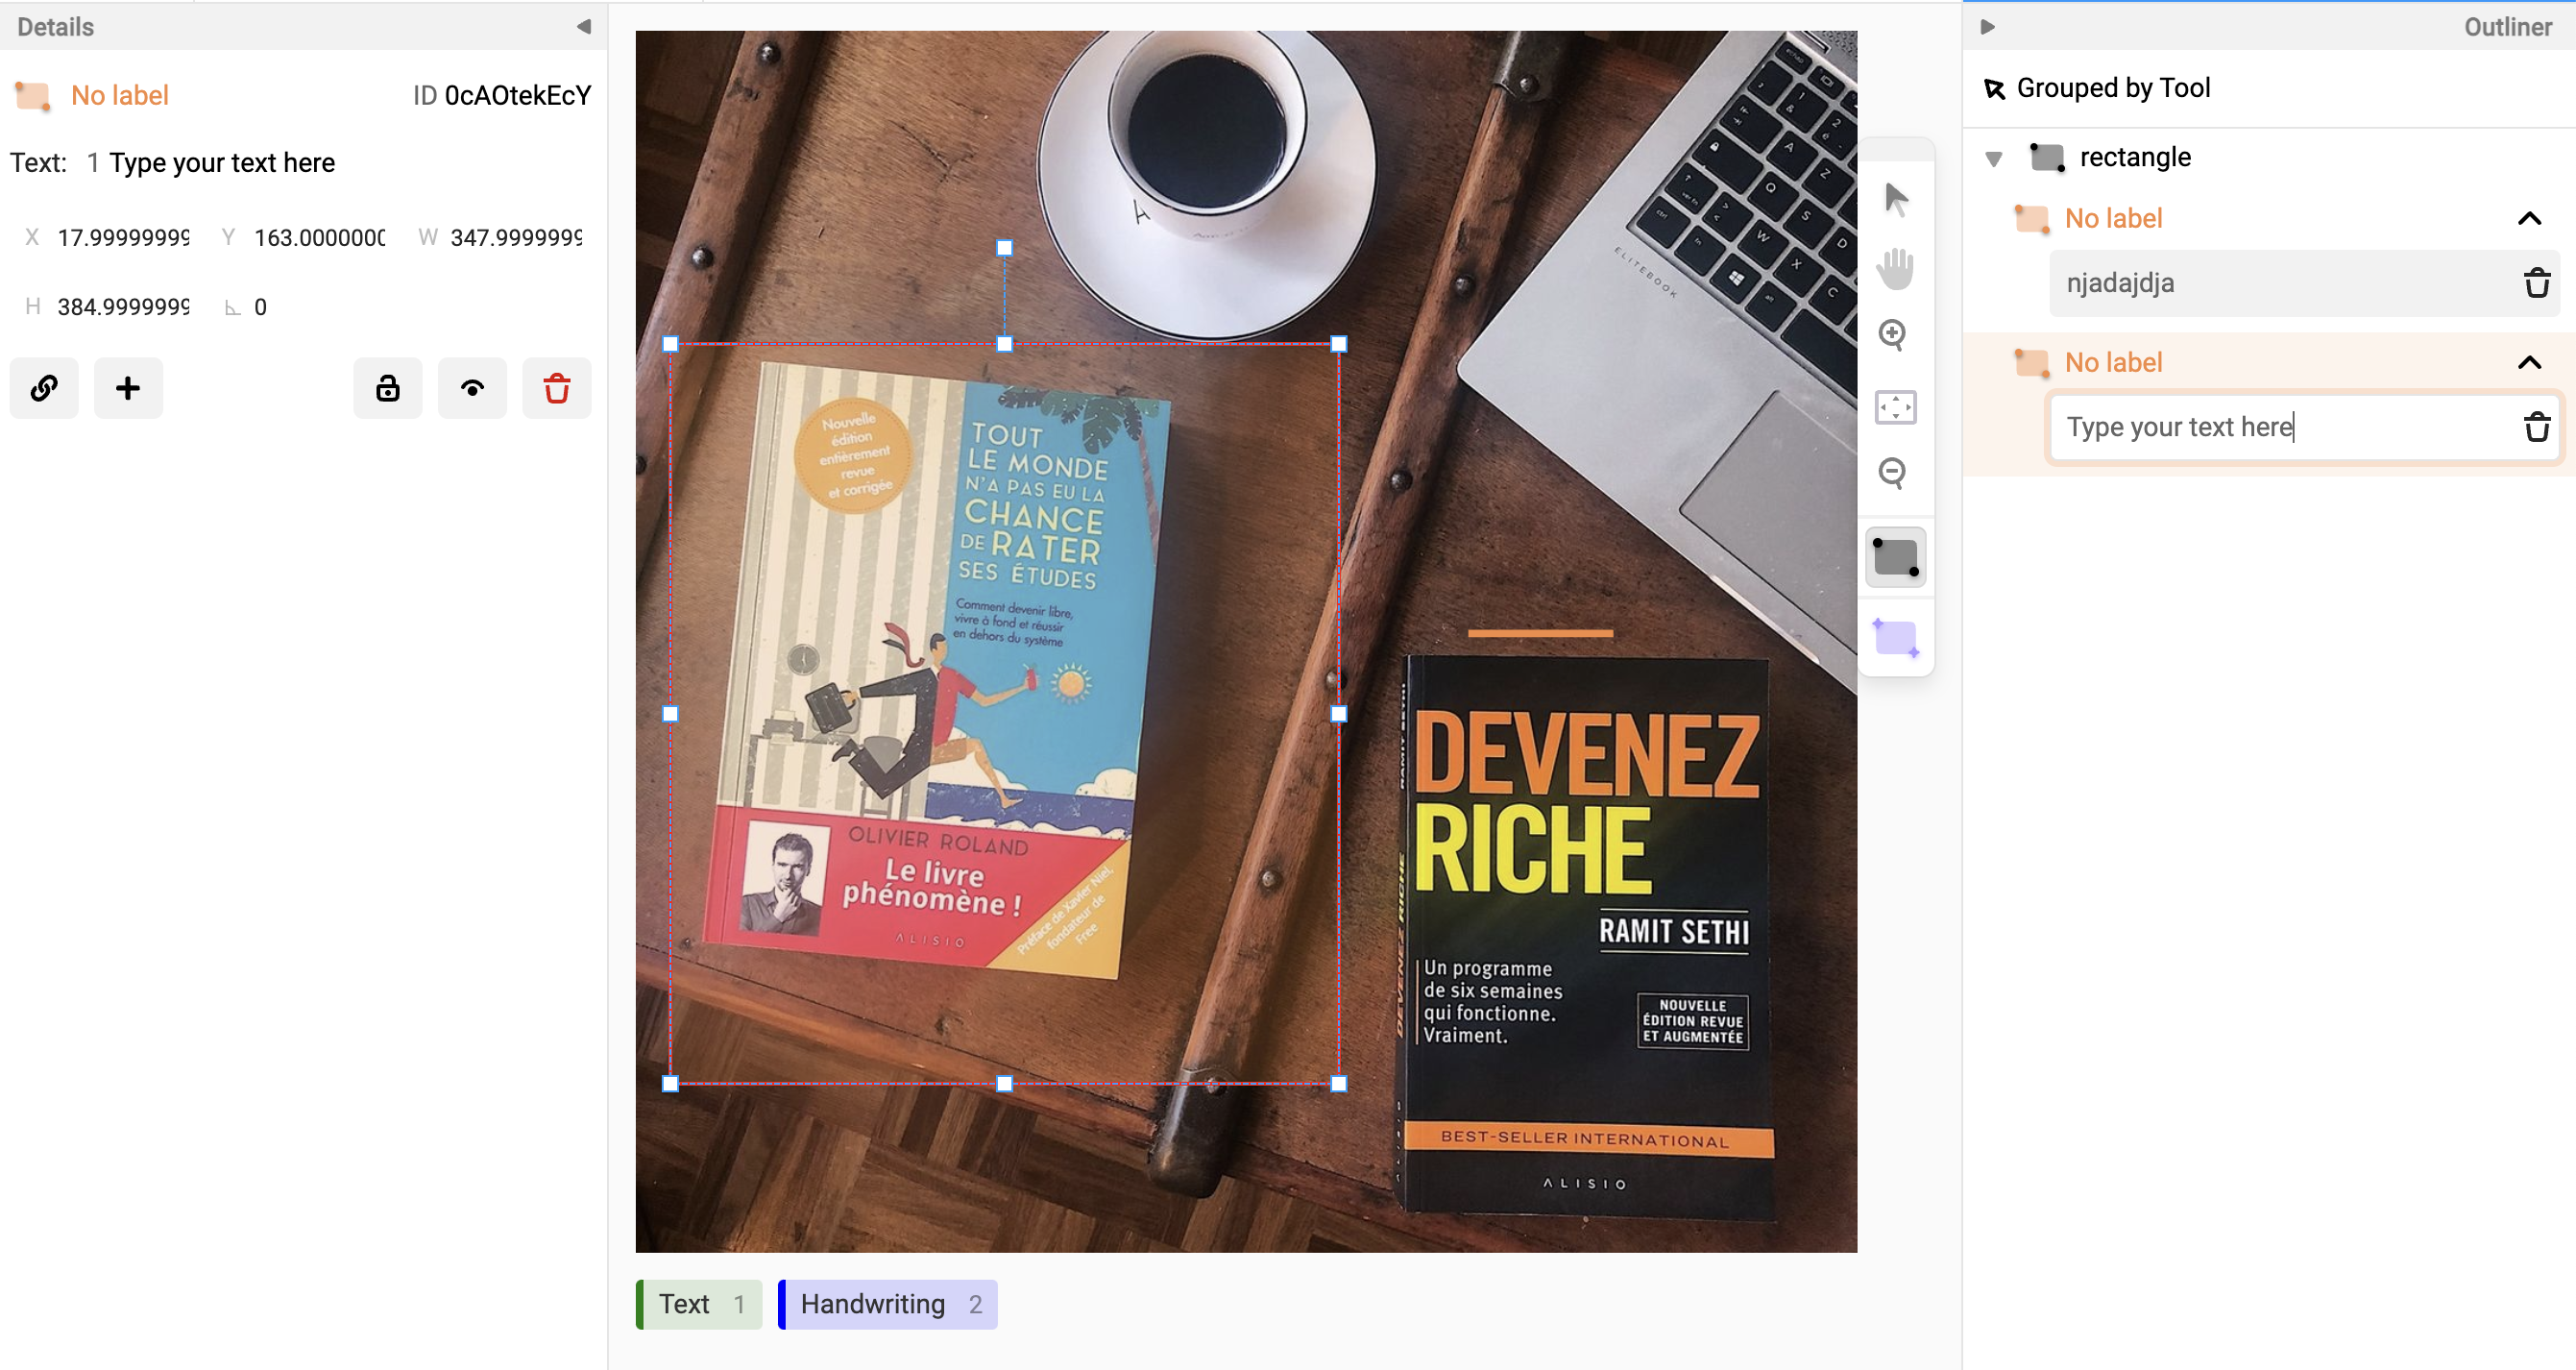
Region editor
You can edit regions with a focus on labeling. You can zoom in and precise control over the numbers and dimensions of each region attribute. The image region details like height, rotation, and so on can be changed using the inputs in the Details panel. Now, you can collapse all panels and get the maximum working area. This feature design makes some actions clear in the product user interface.
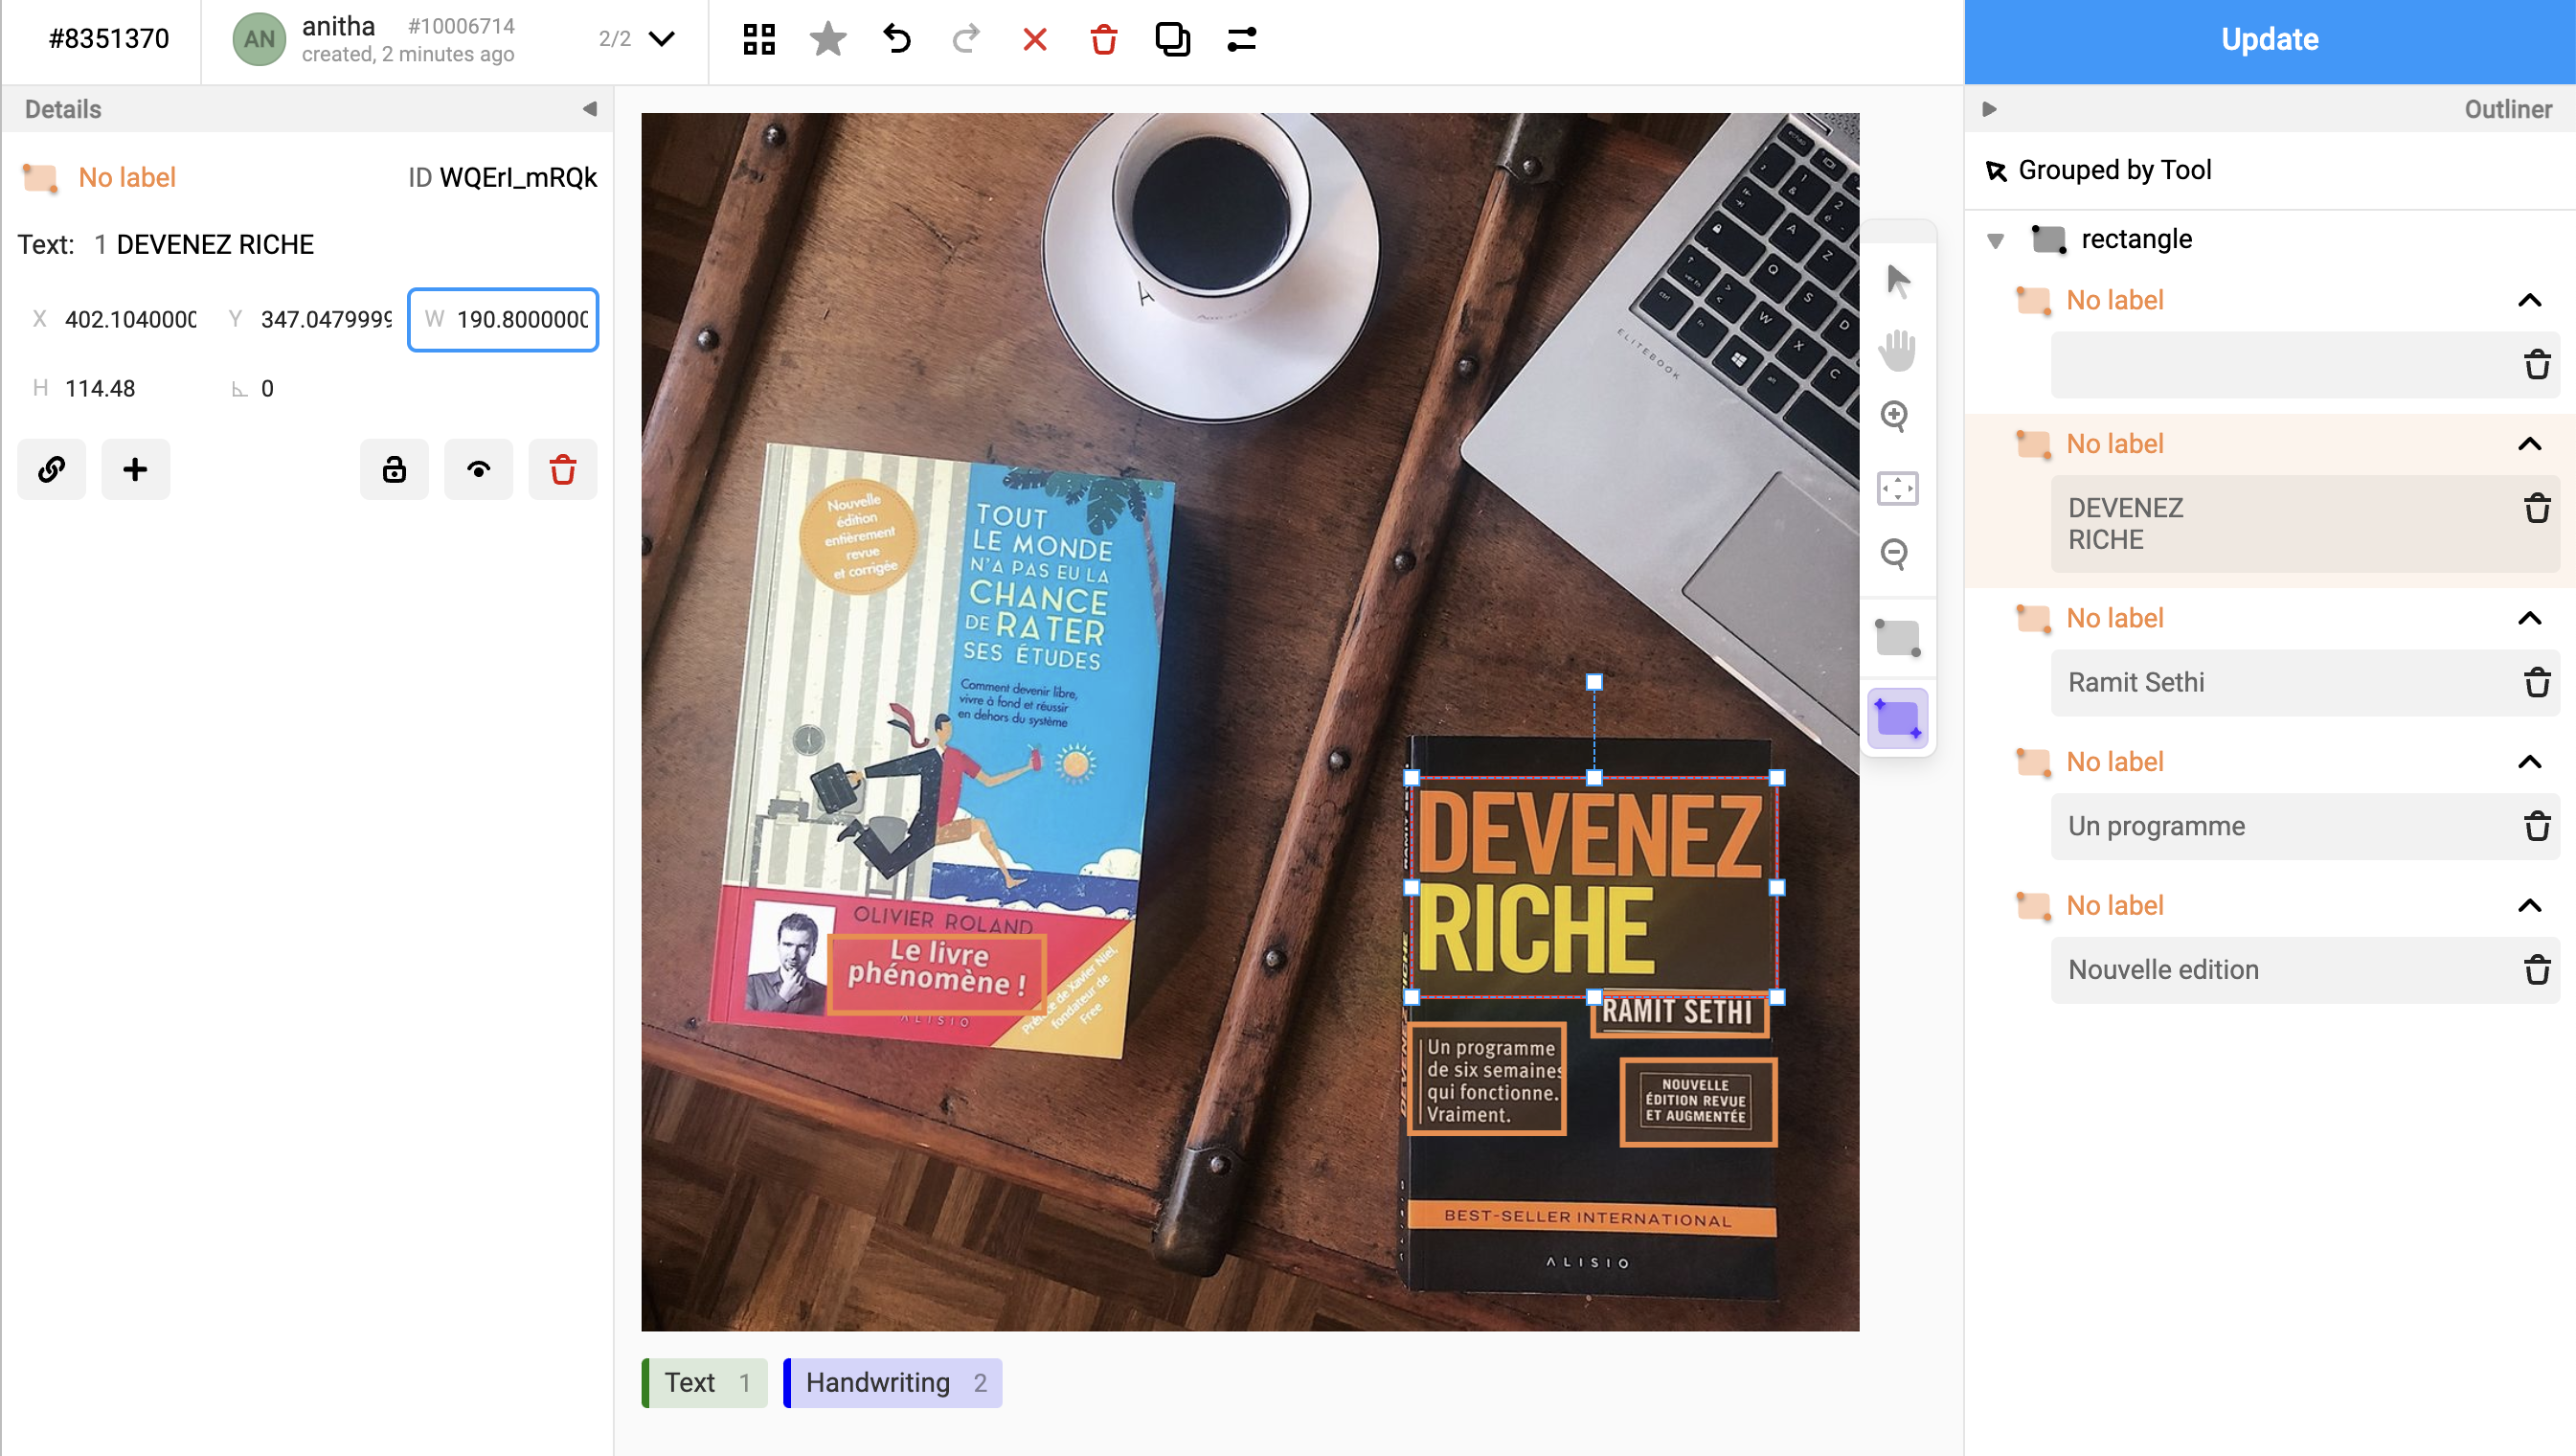 Figure 12: Edit regions using different attributes
note
In the upcoming releases, video segmentation will be available to control keyframes, animations, and custom metadata.
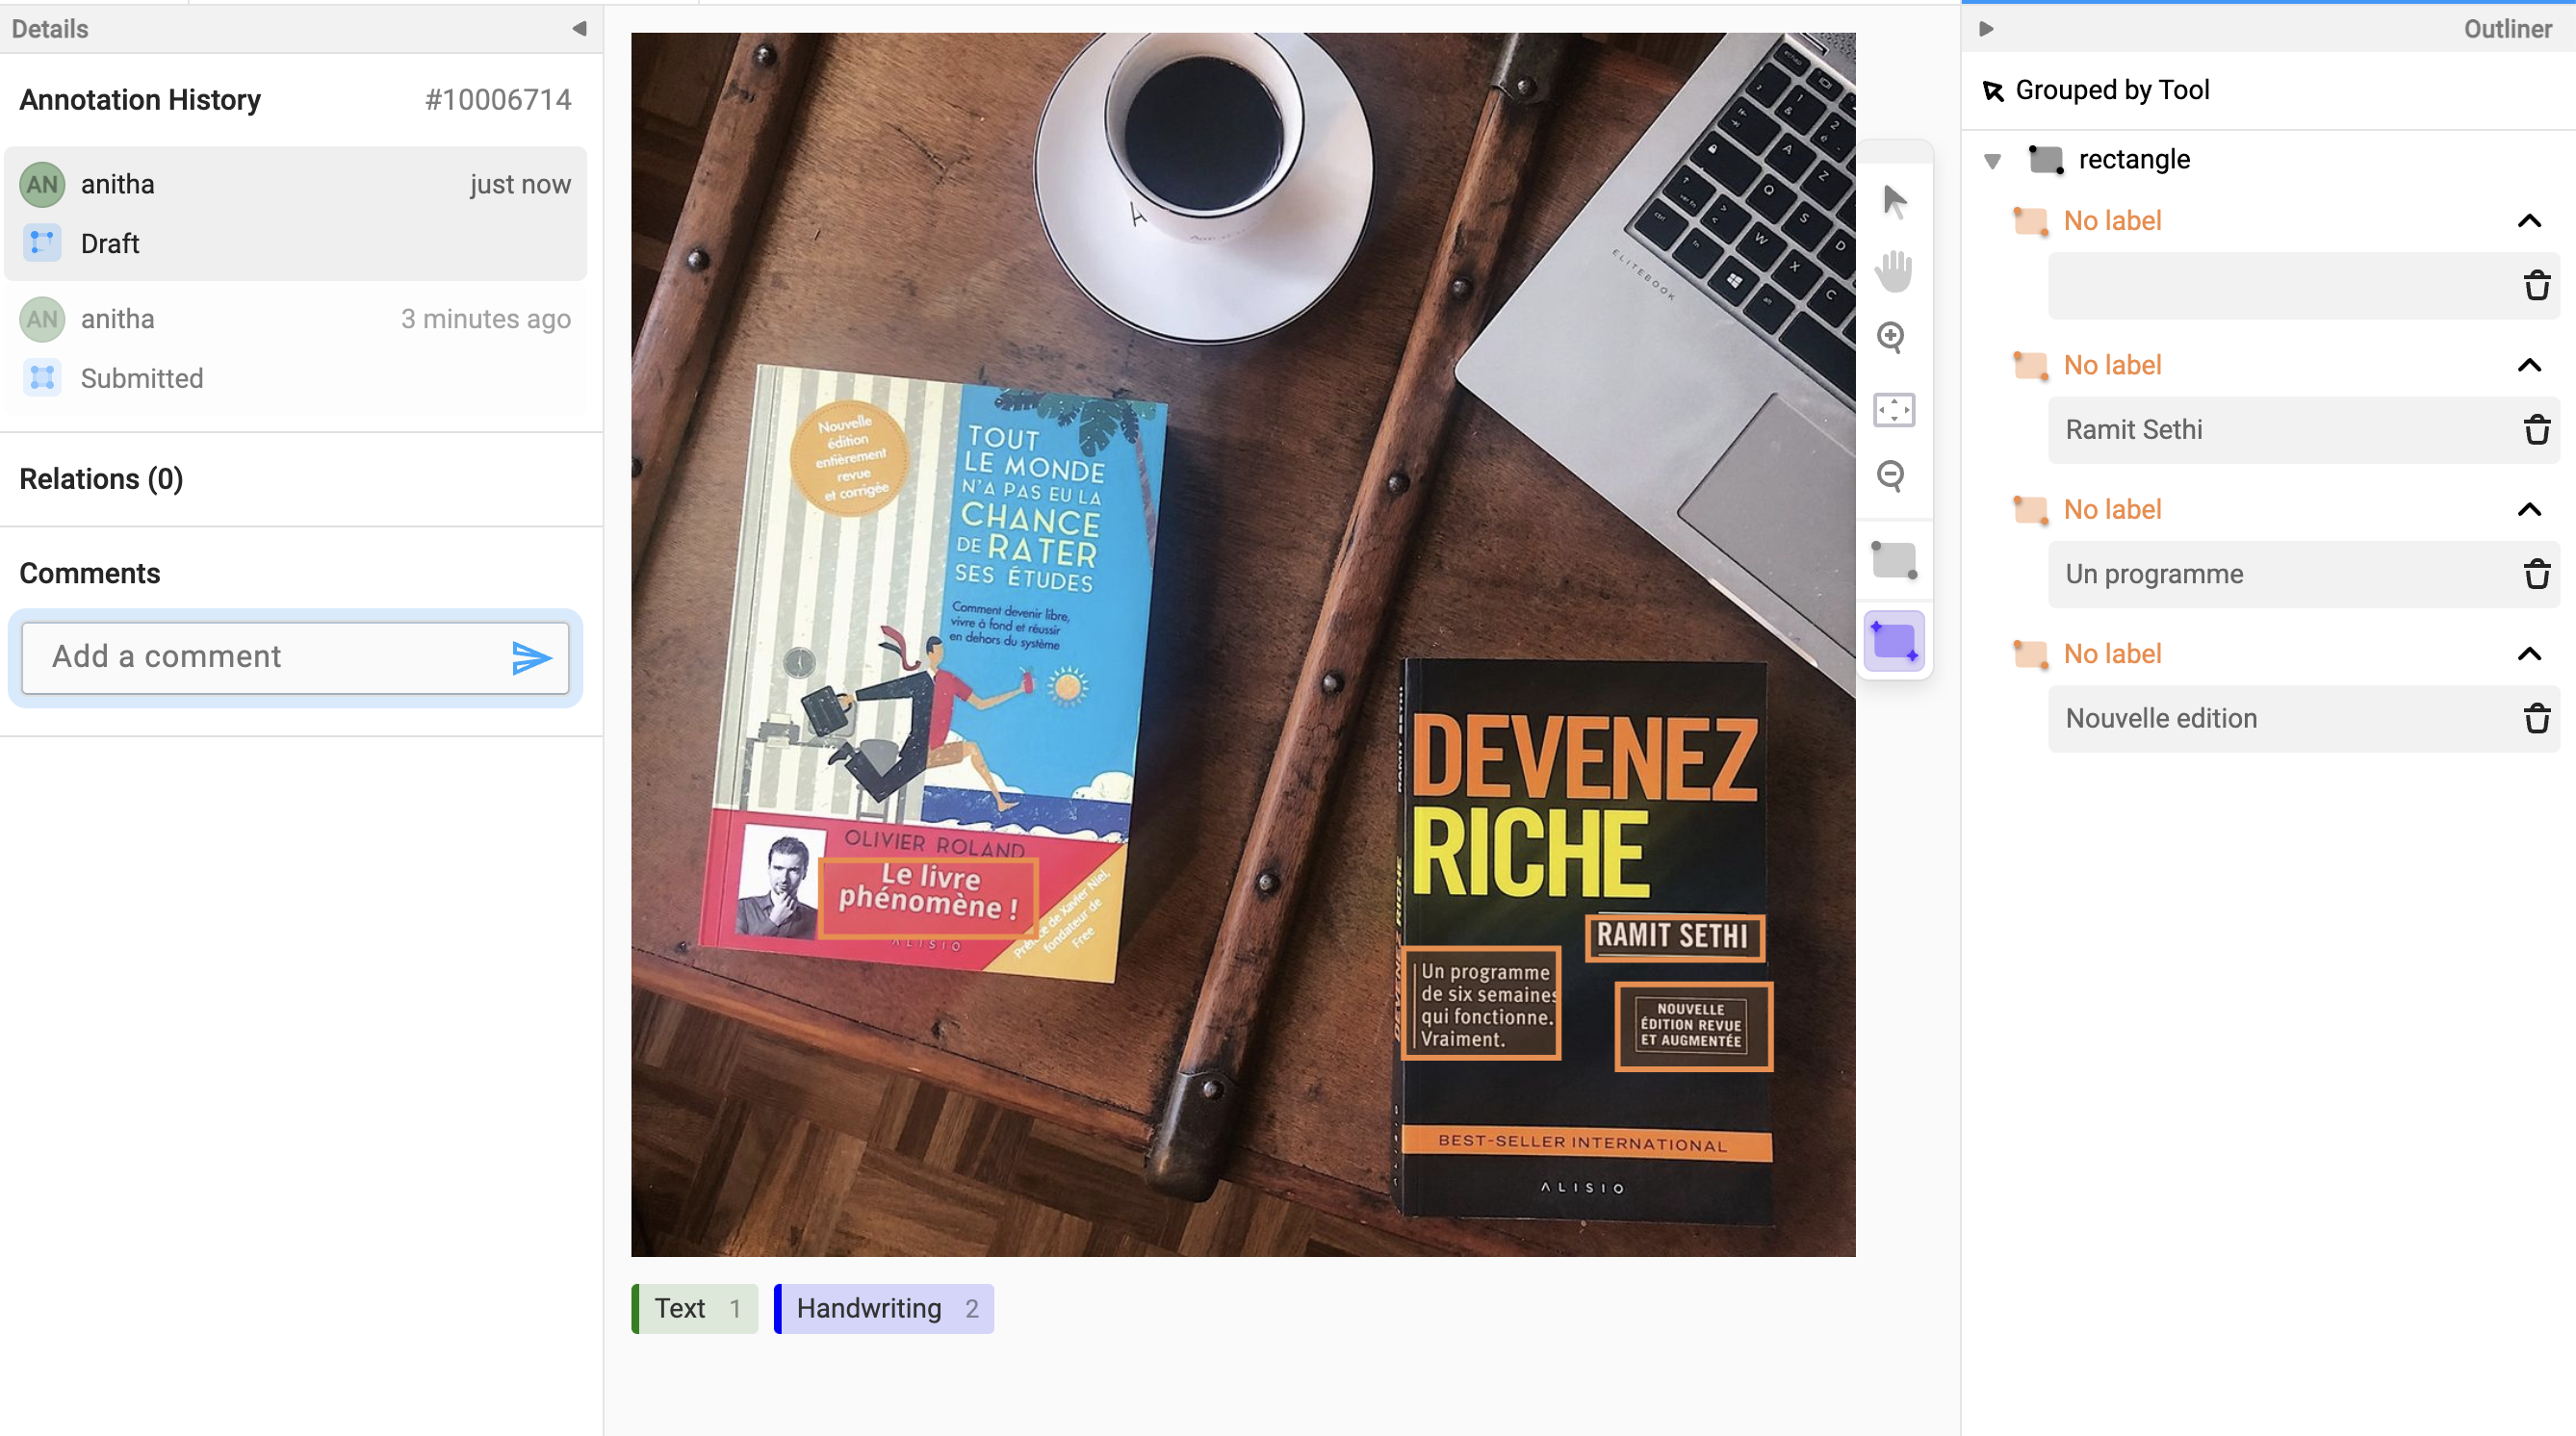 Figure 13: Comments box
note
Use Outliner to work with larger annotation tasks (many bounding boxes in one image, larger videos, and so on).
To add a region in the OCR transcription templates, draw a rectangle, and you can see a text box that appears in the Outliner panel to enter OCR text. The new functionality allows you to select a region and the Details panel changes. You can experience the following:
- See a text that is attached to the OCR case.
- Control the coordinates of the rectangle. For example, you can rotate, move, and resize the coordinates.
- Lock the region to prevent it from moving.
- Hiding/locking regions.
- Use the move tool to prevent the movement of regions.
- Hide or show a selected region.
Regions grouping or sorting
You can group or sort regions using the following functionality from the drop-down list.
- Group Manually: Manual regions grouping (drag-and-drop). When you select this option, you can drag and drop regions inside each other, create a tree structure, and group the regions together.
- Group by Tool: When you select this option, the tools (rectangle, polygons) are added. You can use a template with all these tools to group regions by a tool that generates them.
- Group by Label: When you select this option and draw a region, now you will see a text label, and you can expand it. The text label shows only the text related to this functionality.
warning
Group by Label and Group by Tool options does not work for multiple image scenario or multiple labeled type scenario; only the Group Manually option is available for this mode.
You can also order your regions by Order by Score or Order by Time options.
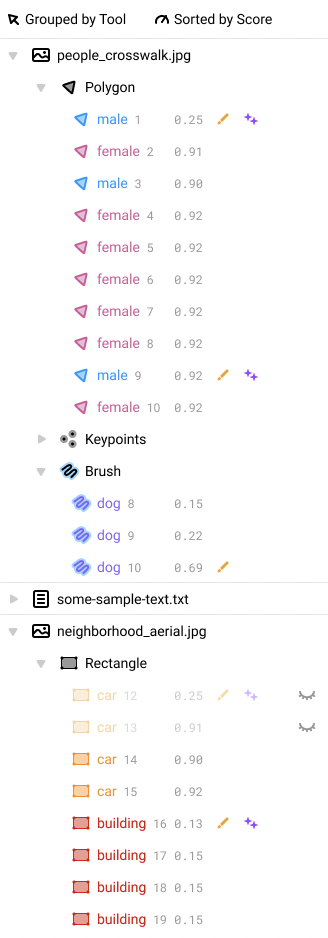 Figure 15: Group by tool using sorted by score
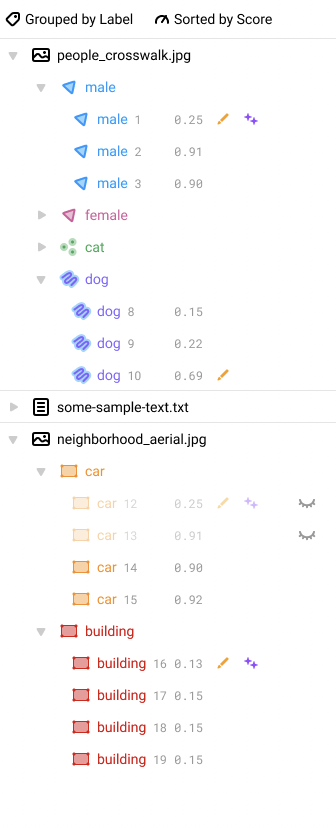 Figure 16: Group by label using sorted by score
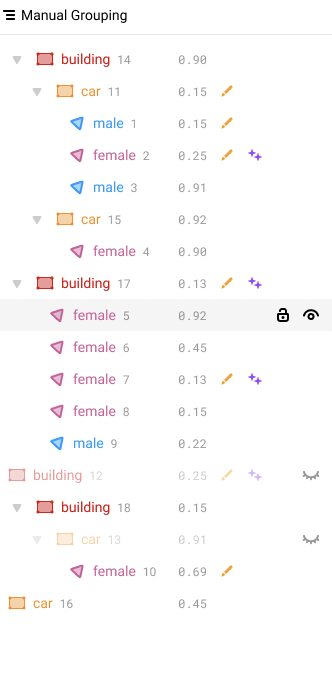 Figure 17: Manual grouping
Prediction indication of the region This capability shows whether an ML model created the region or not.
Relations list One region belongs to another one. It is typically done for NLP type of text. For example, consider the city name as region 1 and district name as region 2. Now, in the relations list hierarchy you will place the region 2 under region 1. Relation lists can be unidirectional or bidirectional between one region and another. You can snap one region into another region.
note
The relations list does not support multi-level listing for regions.
Draw bounding boxes over another
important
When creating bounding box annotations for images, you must not start a bounding box inside another bounding box because it would just drag the first box. Instead, it would create a new bounding box in front of the image when the rectangle tool is selected.
To create bounding boxes on top you can use two ways:
- Press the rectangle tool (R).
note
This option is not always visible.
- Label a bounding box, and then label another bounding box inside it.
Now, you should be able to drag when the rectangle tool is not selected. Remember that when the rectangle tool is selected, you can make rectangles even if it is on top of another rectangle.
OR
- Press CTRL button and start drawing bounding box over another one.
How Label Studio saves results in annotations
Each annotation that you create when you label a task contains regions and results.
- Regions refer to the selected area of the data, whether a text span, image area, audio segment, or another entity.
- Results refer to the labels assigned to the region.
Each region has a unique ID for each annotation, formed as a string with the characters A-Za-z0-9_-. Each result ID is the same as the region ID that it applies to.
When a prediction is used to create an annotation, the result IDs stay the same in the annotation field. This allows you to track the regions generated by your machine learning model and compare them directly to the human-created and reviewed annotations.