Signal Quality
Identify regions on a time series and rate and classify the quality of the signal.
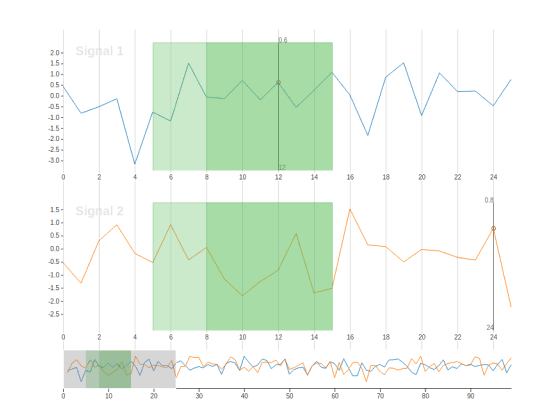
Interactive Template Preview
Labeling Configuration
<View>
    <View visibleWhen="no-region-selected"
          style="height:120px">
        <TimeSeriesLabels name="label" toName="ts">
            <Label value="Region" background="#5b5"/>
        </TimeSeriesLabels>
    </View>

    <View visibleWhen="region-selected" style="height:120px">
        <Rating name="rating" toName="ts"
                maxRating="10" icon="star"
                perRegion="true"/>
        <Choices name="choices" toName="ts"
                 showInline="true" required="true"
                 perRegion="true">
            <Choice value="Good"/>
            <Choice value="Medium"/>
            <Choice value="Poor"/>
        </Choices>
    </View>
    <TimeSeries name="ts" valueType="url" value="$csv"
                sep="," timeColumn="time">
        <Channel column="signal_1"
                 strokeColor="#17b" legend="Signal 1"/>
        <Channel column="signal_2"
                 strokeColor="#f70" legend="Signal 2"/>
    </TimeSeries>
</View>
About the labeling configuration
All labeling configurations must be wrapped in View tags.
Use the visibleWhen parameter with the View tag to create a section of the labeling configuration that is only visible when no region is selected:
<View visibleWhen="no-region-selected"
          style="height:120px">
When that section of the labeling interface is visible, annotators can use the TimeSeriesLabels control tag to label specific regions on the time series data:
    <TimeSeriesLabels name="label" toName="ts">
        <Label value="Region" background="#5b5"/>
    </TimeSeriesLabels>
</View>
Use the visibleWhen parameter with a different View tag to create a section of the labeling interface that is visible only when a region is selected:
<View visibleWhen="region-selected" style="height:120px">When that section of the labeling interface is visible, annotators can use the Rating control tag to select a 10 star rating for the selected region:
<Rating name="rating" toName="ts"
                maxRating="10" icon="star"
                perRegion="true"/>
The perRegion="true" parameter means that this rating only applies to the selected region.
Still within that region-specific section of the labeling interface, annotators can use the Choices control tag to select a choice for the selected region:
    <Choices name="choices" toName="ts"
             showInline="true" required="true"
             perRegion="true">
        <Choice value="Good"/>
        <Choice value="Medium"/>
        <Choice value="Poor"/>
    </Choices>
</View>
Use the TimeSeries object tag and the Channel tag to display the TimeSeries data and channels to the annotators:
<TimeSeries name="ts" valueType="url" value="$csv"
            sep="," timeColumn="time">
    <Channel column="signal_1"
             strokeColor="#17b" legend="Signal 1"/>
    <Channel column="signal_2"
             strokeColor="#f70" legend="Signal 2"/>
</TimeSeries>