Time Series Classification
If you need to train a machine learning model to classify time series data, create a dataset using this template. This template provides a way for annotators to classify the entire time series signal graph, and an option to classify specific parts of the graph as types of activity. You can combine these classification methods or use only one.
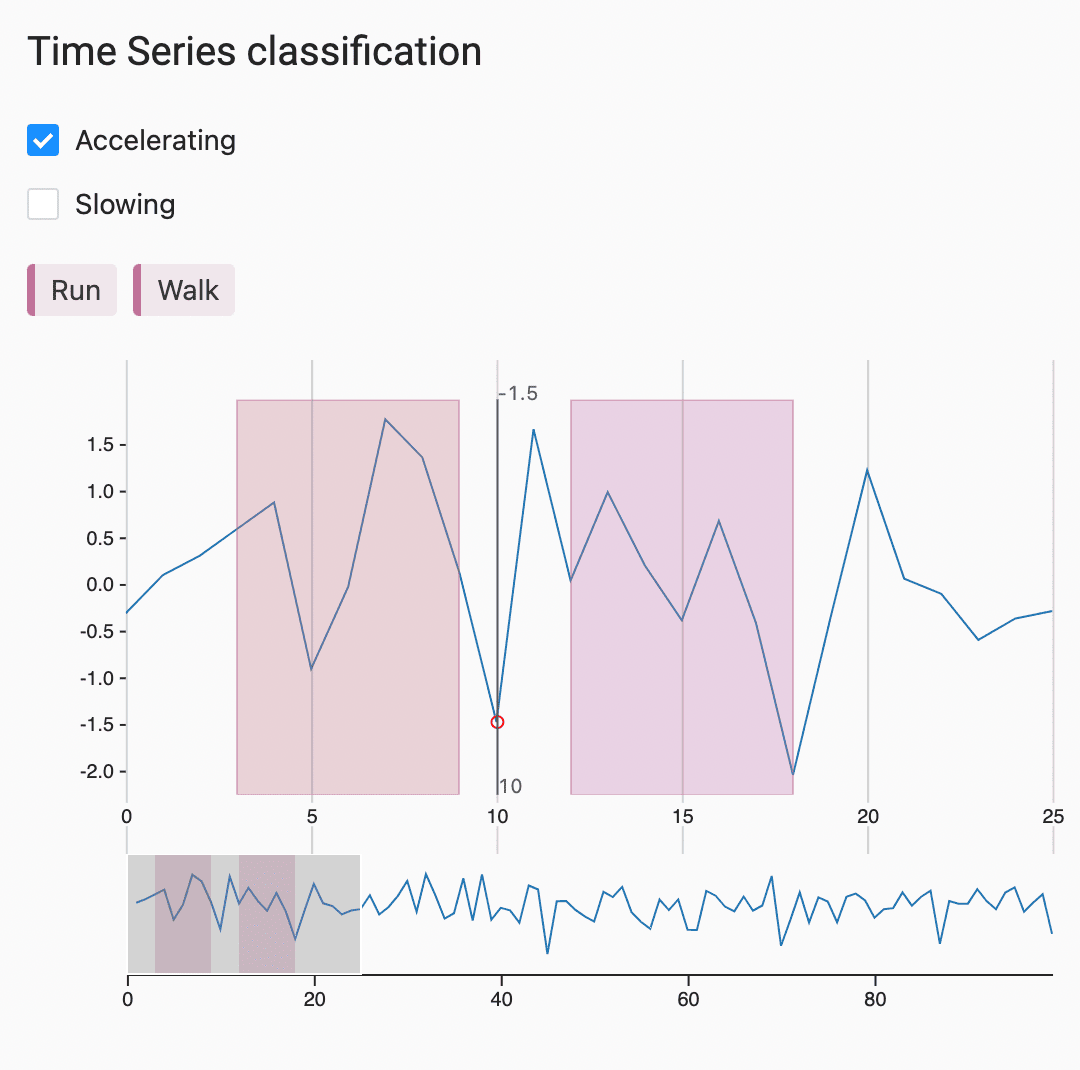
Interactive Template Preview
Labeling Configuration
<View>
    <Header value="Time Series classification"
            style="font-weight: normal"/>
    <Choices name="pattern" toName="ts">
        <Choice value="Accelerating"/>
        <Choice value="Slowing"/>
    </Choices>
    <TimeSeriesLabels name="label" toName="ts">
        <Label value="Run"/>
        <Label value="Walk"/>
    </TimeSeriesLabels>
    <TimeSeries name="ts" value="$csv" valueType="url">
        <Channel column="first_column"/>
    </TimeSeries>
</View>
About the labeling configuration
All labeling configurations must be wrapped in View tags.
You can add a header to provide instructions to the annotator:
<Header value="Time Series classification"
            style="font-weight: normal"/>
The style parameter overrides the default styling of the header to show a normal font weight instead of bold.
The Choices control tag lets annotators classify the entire time series graph:
<Choices name="pattern" toName="ts">
    <Choice value="Accelerating"/>
    <Choice value="Slowing"/>
</Choices>
The TimeSeriesLabels control tag lets annotators classify specific regions of the time series graph as specific activities:
<TimeSeriesLabels name="label" toName="ts">
    <Label value="Run"/>
    <Label value="Walk"/>
</TimeSeriesLabels>
The TimeSeries object tag specifies the location of the time series data:
<TimeSeries name="ts" value="$csv" valueType="url">
    <Channel column="first_column"/>
</TimeSeries>