Time Series Forecasting
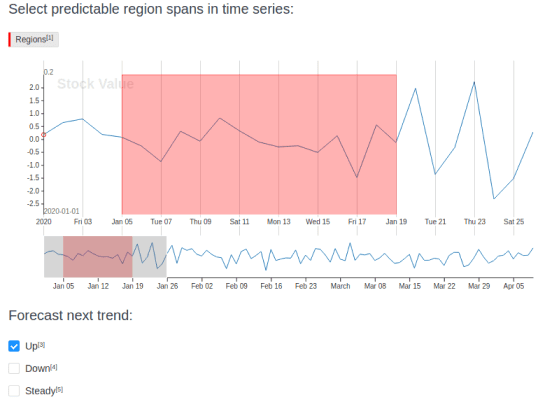
To train a machine learning model to perform forecasting on time series data, create a dataset using this template. This template prompts annotators to highlight predictable region spans in the time series channels and label them as “Regions”, then identify the trend forecast for a specific region.
Interactive Template Preview
Labeling Configuration
<View>
    <Header value="Select predictable region spans in time series:"/>
    <TimeSeriesLabels name="predictable" toName="stock">
        <Label value="Regions" background="red" />
    </TimeSeriesLabels>

    <!-- Use the TimeSeries object tag to display time series data -->
    <TimeSeries name="stock" valueType="url" value="$csv"
                sep=","
                timeColumn="time"
                timeFormat="%Y-%m-%d %H:%M:%S.%f"
                timeDisplayFormat="%Y-%m-%d"
                overviewChannels="value">
<!--Use the Channel tag to specify the name and format of the time series channel-->
        <Channel column="value"
                 displayFormat=",.1f"
                 strokeColor="#1f77b4"
                 legend="Stock Value"/>
    </TimeSeries>
    <Header value="Forecast next trend:"/>
    <!--Use the Choices control tag to prompt annotators to choose
    the trend for the time series graph-->
    <Choices name="trend_forecast" toName="stock">
        <Choice value="Up"/>
        <Choice value="Down"/>
        <Choice value="Steady"/>
    </Choices>
</View>
About the labeling configuration
All labeling configurations must be wrapped in View tags.
You can add a header to provide instructions to the annotator:
<Header value="Select predictable region spans in time series:"/>Use the TimeSeriesLabels control tag to provide a way to label specific regions on the time series graph:
<TimeSeriesLabels name="predictable" toName="stock">
        <Label value="Regions" background="red" />
</TimeSeriesLabels>
Use the TimeSeries object tag to display time series data. The valueType="url" parameter specifies that the time series data is available as a URL, rather than a file, and the value="$csv" parameter specifies that the URL is stored in a data key called csv. The sep="," parameter specifies that a comma is the data separator, as is standard for a CSV-formatted file. The time parameters specify which column contains the time data, the format of the time data in the file, and how to display the time data on the labeling interface.
<TimeSeries name="stock" valueType="url" value="$csv"
            sep=","
            timeColumn="time"
            timeFormat="%Y-%m-%d %H:%M:%S.%f"
            timeDisplayFormat="%Y-%m-%d"
            overviewChannels="value">
    <Channel column="value"
             displayFormat=",.1f"
             strokeColor="#1f77b4"
             legend="Stock Value"/>
</TimeSeries>
Use the Channel tag to specify the name and display format, using d3 format, of the time series channel. You can use the legend parameter to specify the value to use for describing the channel.
Use the Choices control tag to prompt annotators to choose the trend for the overall time series graph:
<Choices name="trend_forecast" toName="stock">
    <Choice value="Up"/>
    <Choice value="Down"/>
    <Choice value="Steady"/>
</Choices>