Change Point Detection
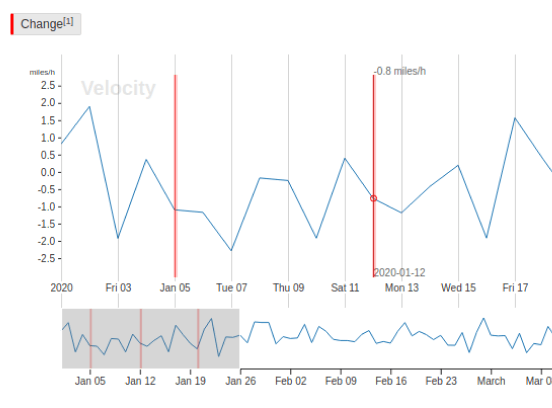
If you need to find sudden changes in time series data, use this template to perform change point detection. Label the change on relevant time series channels.
Interactive Template Preview
Labeling Configuration
<View>
    <TimeSeriesLabels name="label" toName="ts">
        <Label value="Change" background="red" />
    </TimeSeriesLabels>

    <TimeSeries name="ts" valueType="url" value="$csv"
                sep=","
                timeColumn="time"
                timeFormat="%Y-%m-%d %H:%M:%S.%f"
                timeDisplayFormat="%Y-%m-%d"
                overviewChannels="velocity">

        <Channel column="velocity"
                 units="miles/h"
                 displayFormat=",.1f"
                 strokeColor="#1f77b4"
                 legend="Velocity"/>
    </TimeSeries>
</View>
About the labeling configuration
All labeling configurations must be wrapped in View tags.
Use the TimeSeriesLabels control tag to allow annotators to label the region indicating change on the time series graph:
<TimeSeriesLabels name="label" toName="ts">
    <Label value="Change" background="red" />
</TimeSeriesLabels>
Use the TimeSeries object tag to specify the time series data source. The valueType="url" parameter specifies that the time series data is available as a URL, rather than a file, and the value="$csv" parameter specifies that the URL is stored in a data key called csv. The sep="," parameter specifies that a comma is the data separator, as is standard for a CSV-formatted file. The time parameters specify which column contains the time data, the format of the time data in the file, and how to display the time data on the labeling interface.
<TimeSeries name="ts" valueType="url" value="$csv"
               sep=","
               timeColumn="time"
               timeFormat="%Y-%m-%d %H:%M:%S.%f"
               timeDisplayFormat="%Y-%m-%d"
               overviewChannels="velocity">
       <Channel column="velocity"
                units="miles/h"
                displayFormat=",.1f"
                strokeColor="#1f77b4"
                legend="Velocity"/>
   </TimeSeries>
The overviewChannels parameter in the TimeSeries tag specifies the column in the time series data to display on the time series graph as a channel. You can then use the Channel tag and its parameters to provide details about the data, such as the units of the data, the displayFormat of the channel data using d3 format, the strokeColor to use when highlighting the channel, and the name of the channel as it should appear in the labeling interface legend.